What's New?

December 28, 2023

Correlations 2.0

Dear Graphext users, 

We're rolling out an update to the correlations section, now called Correlations 2.0, for all our Graphext users. Here's a quick refresher on what the correlations section does: It's a handy tool within Graphext that lets you pick a variable you're interested in, and then it shows you how that variable correlates with others in your dataset, sorting the results by the highest correlation. This feature is pretty neat because it works with all kinds of variables, including categorical ones, thanks to the mutual information algorithm we use.

What's New in Version 2.0?

  • Pearson Coefficient: We've added the Pearson coefficient to our toolbox, so now you have another way to measure how variables relate to each other, especially useful for linear relationships between continuous variables.
  • More Ways to Visualize Data: Besides the bubble charts we had before, you can now use boxplots and heatmaps for a different look at the correlations in your data. These should give you more insights and make the correlations easier to understand at a glance.

Why We Made These Changes:

We wanted to give you more options and better tools to see and understand the relationships in your data. The Pearson coefficient is a classic statistical tool for a reason, and we think it's a great complement to the mutual information algorithm. As for the new visualizations, we know that a good chart can sometimes tell you more at a glance than a bunch of numbers, so we're excited to offer you more choices there.

Try It Out:

The updated correlations section is ready for you to explore. Check out the new features and see how they can help with your data analysis. We're here for any questions or feedback you might have.


December 13, 2023

Introducing Scatter and Bubble Charts

Dear Graphext users!

Welcome scatter and bubble charts in Graphext 👋🏼


1. Visualize Relationships at a Glance: Say hello to Scatter Plots and Bubble Charts, offering a rapid, intuitive way to understand the connections between your variables. See correlations, trends, outliers, and clusters with a simple glance.

2. Multi-variable Mapping: Take control by mapping not just one or two, but up to four variables simultaneously! Size and color your bubbles based on these variables, unlocking deeper insights within a single visualization.
3. Dynamic Regression Insights: Watch as the regression line dynamically adapts in real-time. Whether you're adjusting categories, filtering data, or modifying variables, the regression line instantly recalculates, aiding in a deeper understanding of your dataset.

4. Instant Statistical Insights: Dive into your data's depth with instant calculations of Pearson and R-squared coefficients. Uncover the strength and direction of relationships between your variables.

5. Tailored Customization: Personalize your visualizations to fit your exact needs. From customizing tooltips to adjusting size ranges and colors, wield complete control over how your data is presented.


Welcome to the world of Scatter Plots and Bubble Charts with Graphext! 🚀


October 13, 2023

AI for Data Wrangling and Data Cleaning

Dear Graphext users!

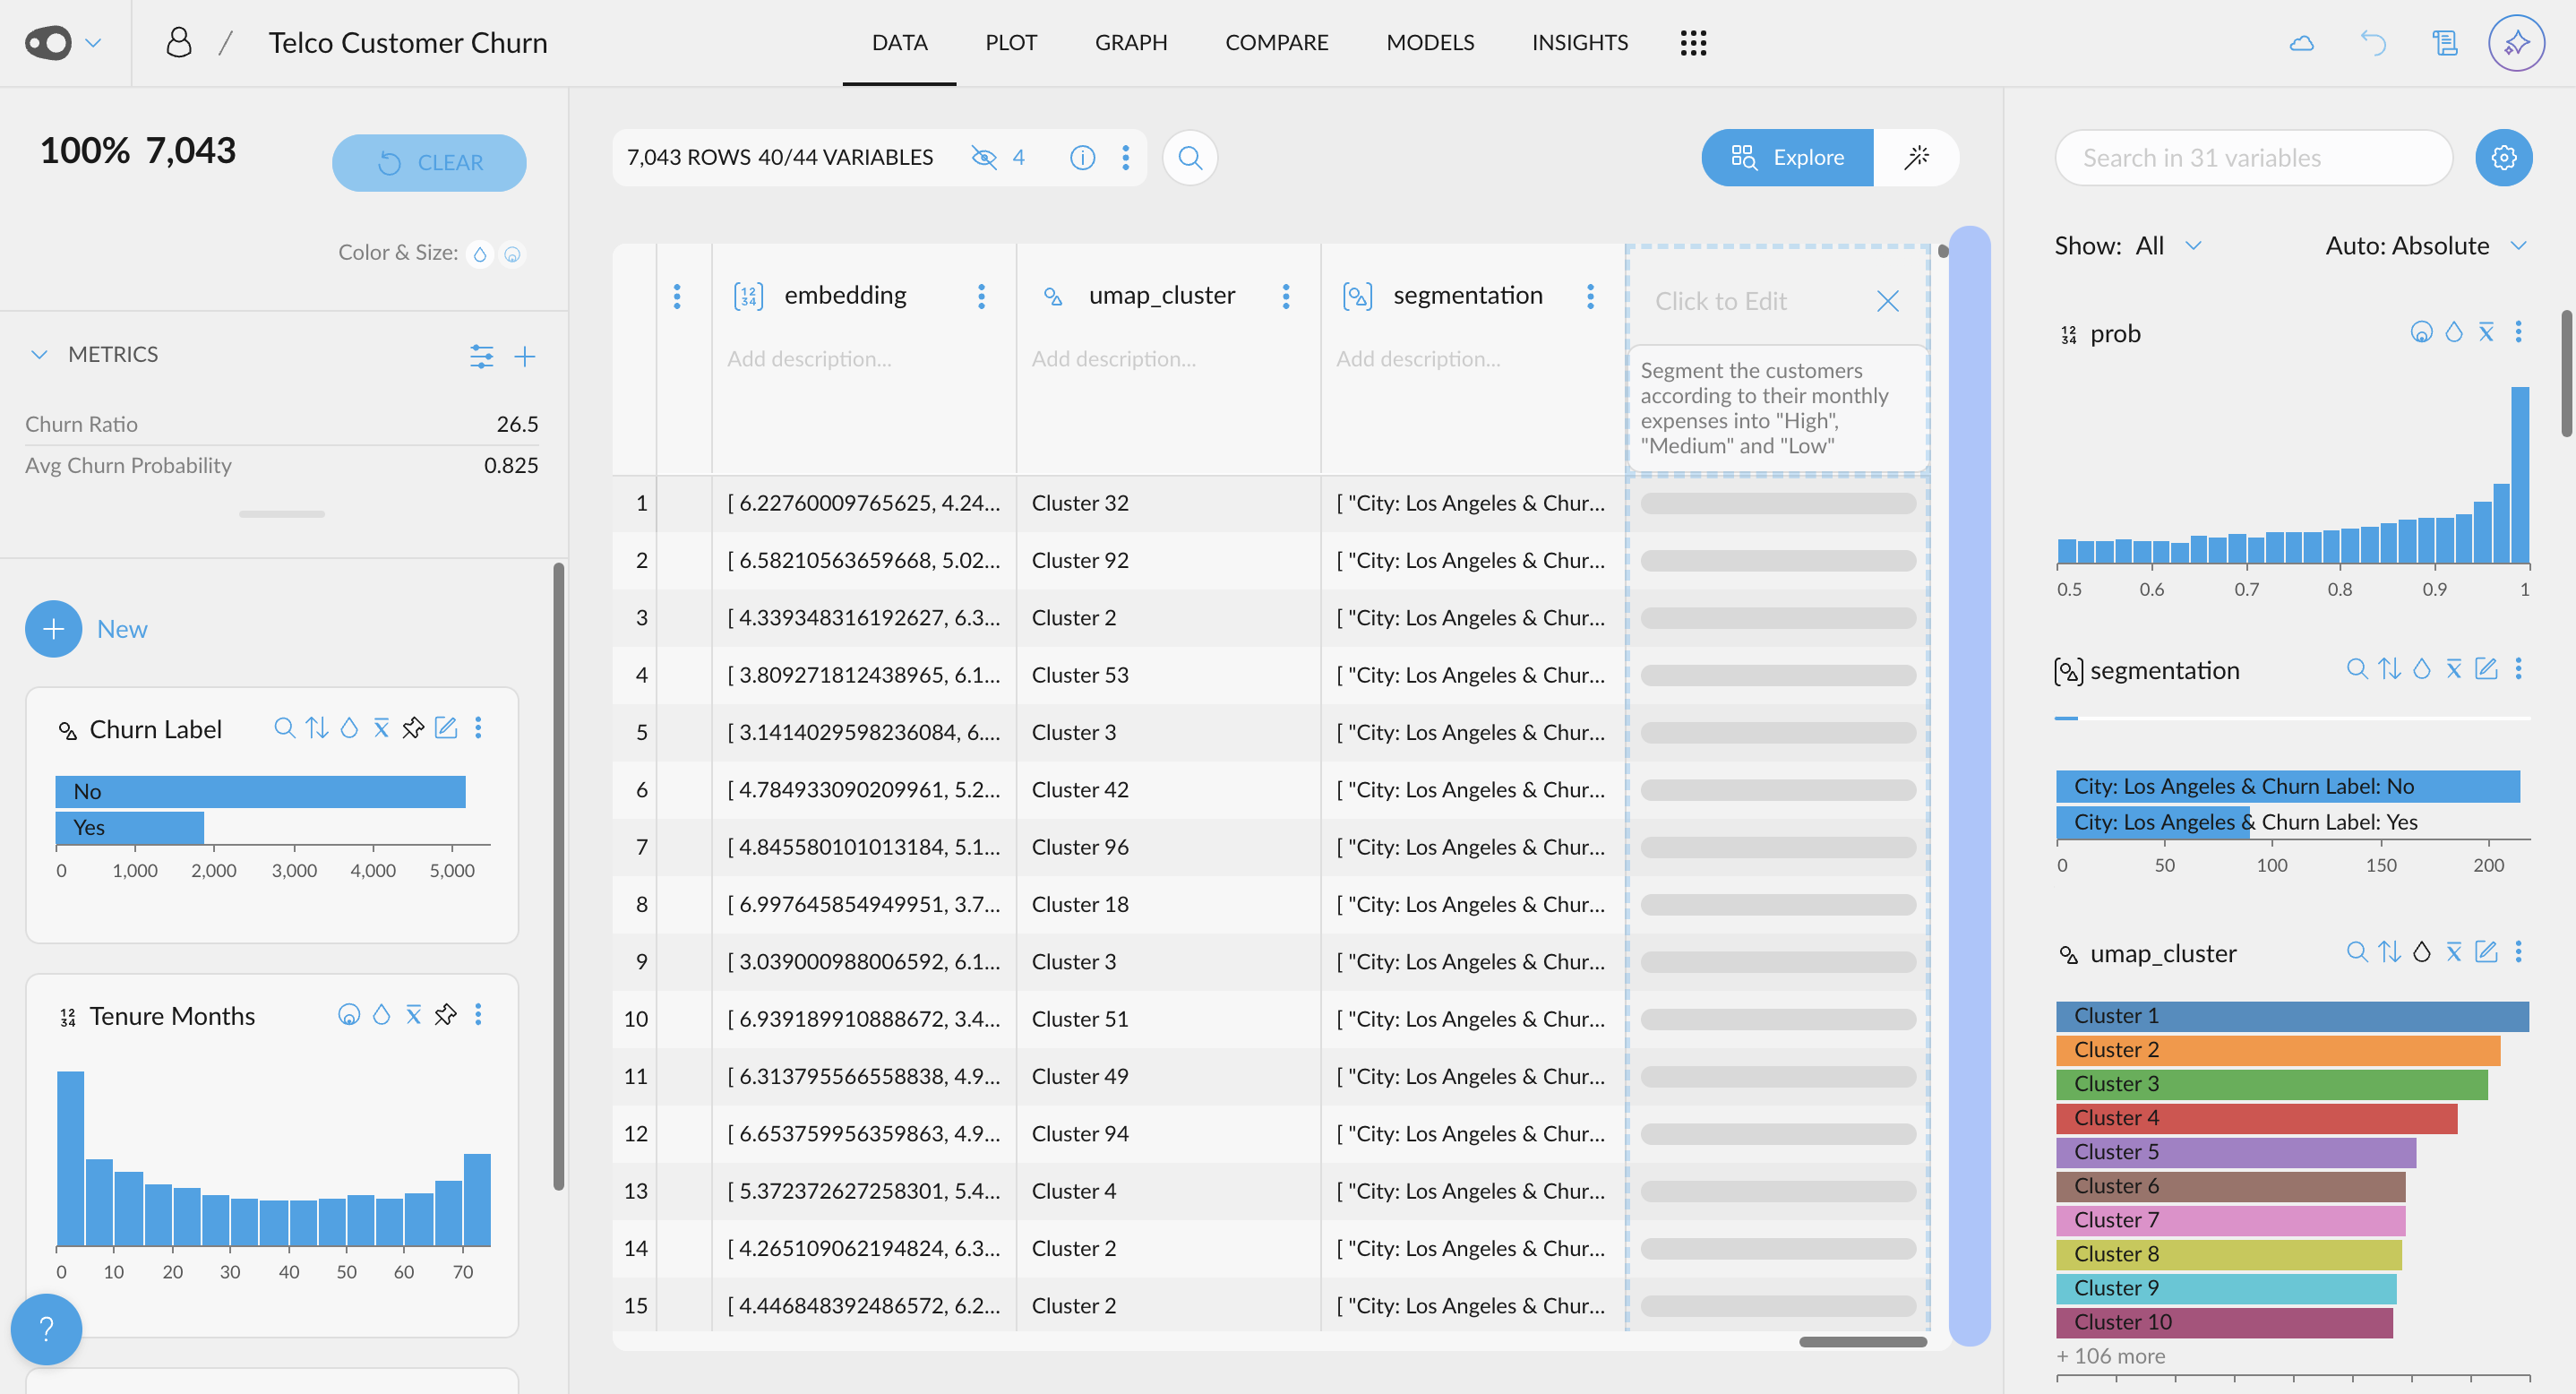
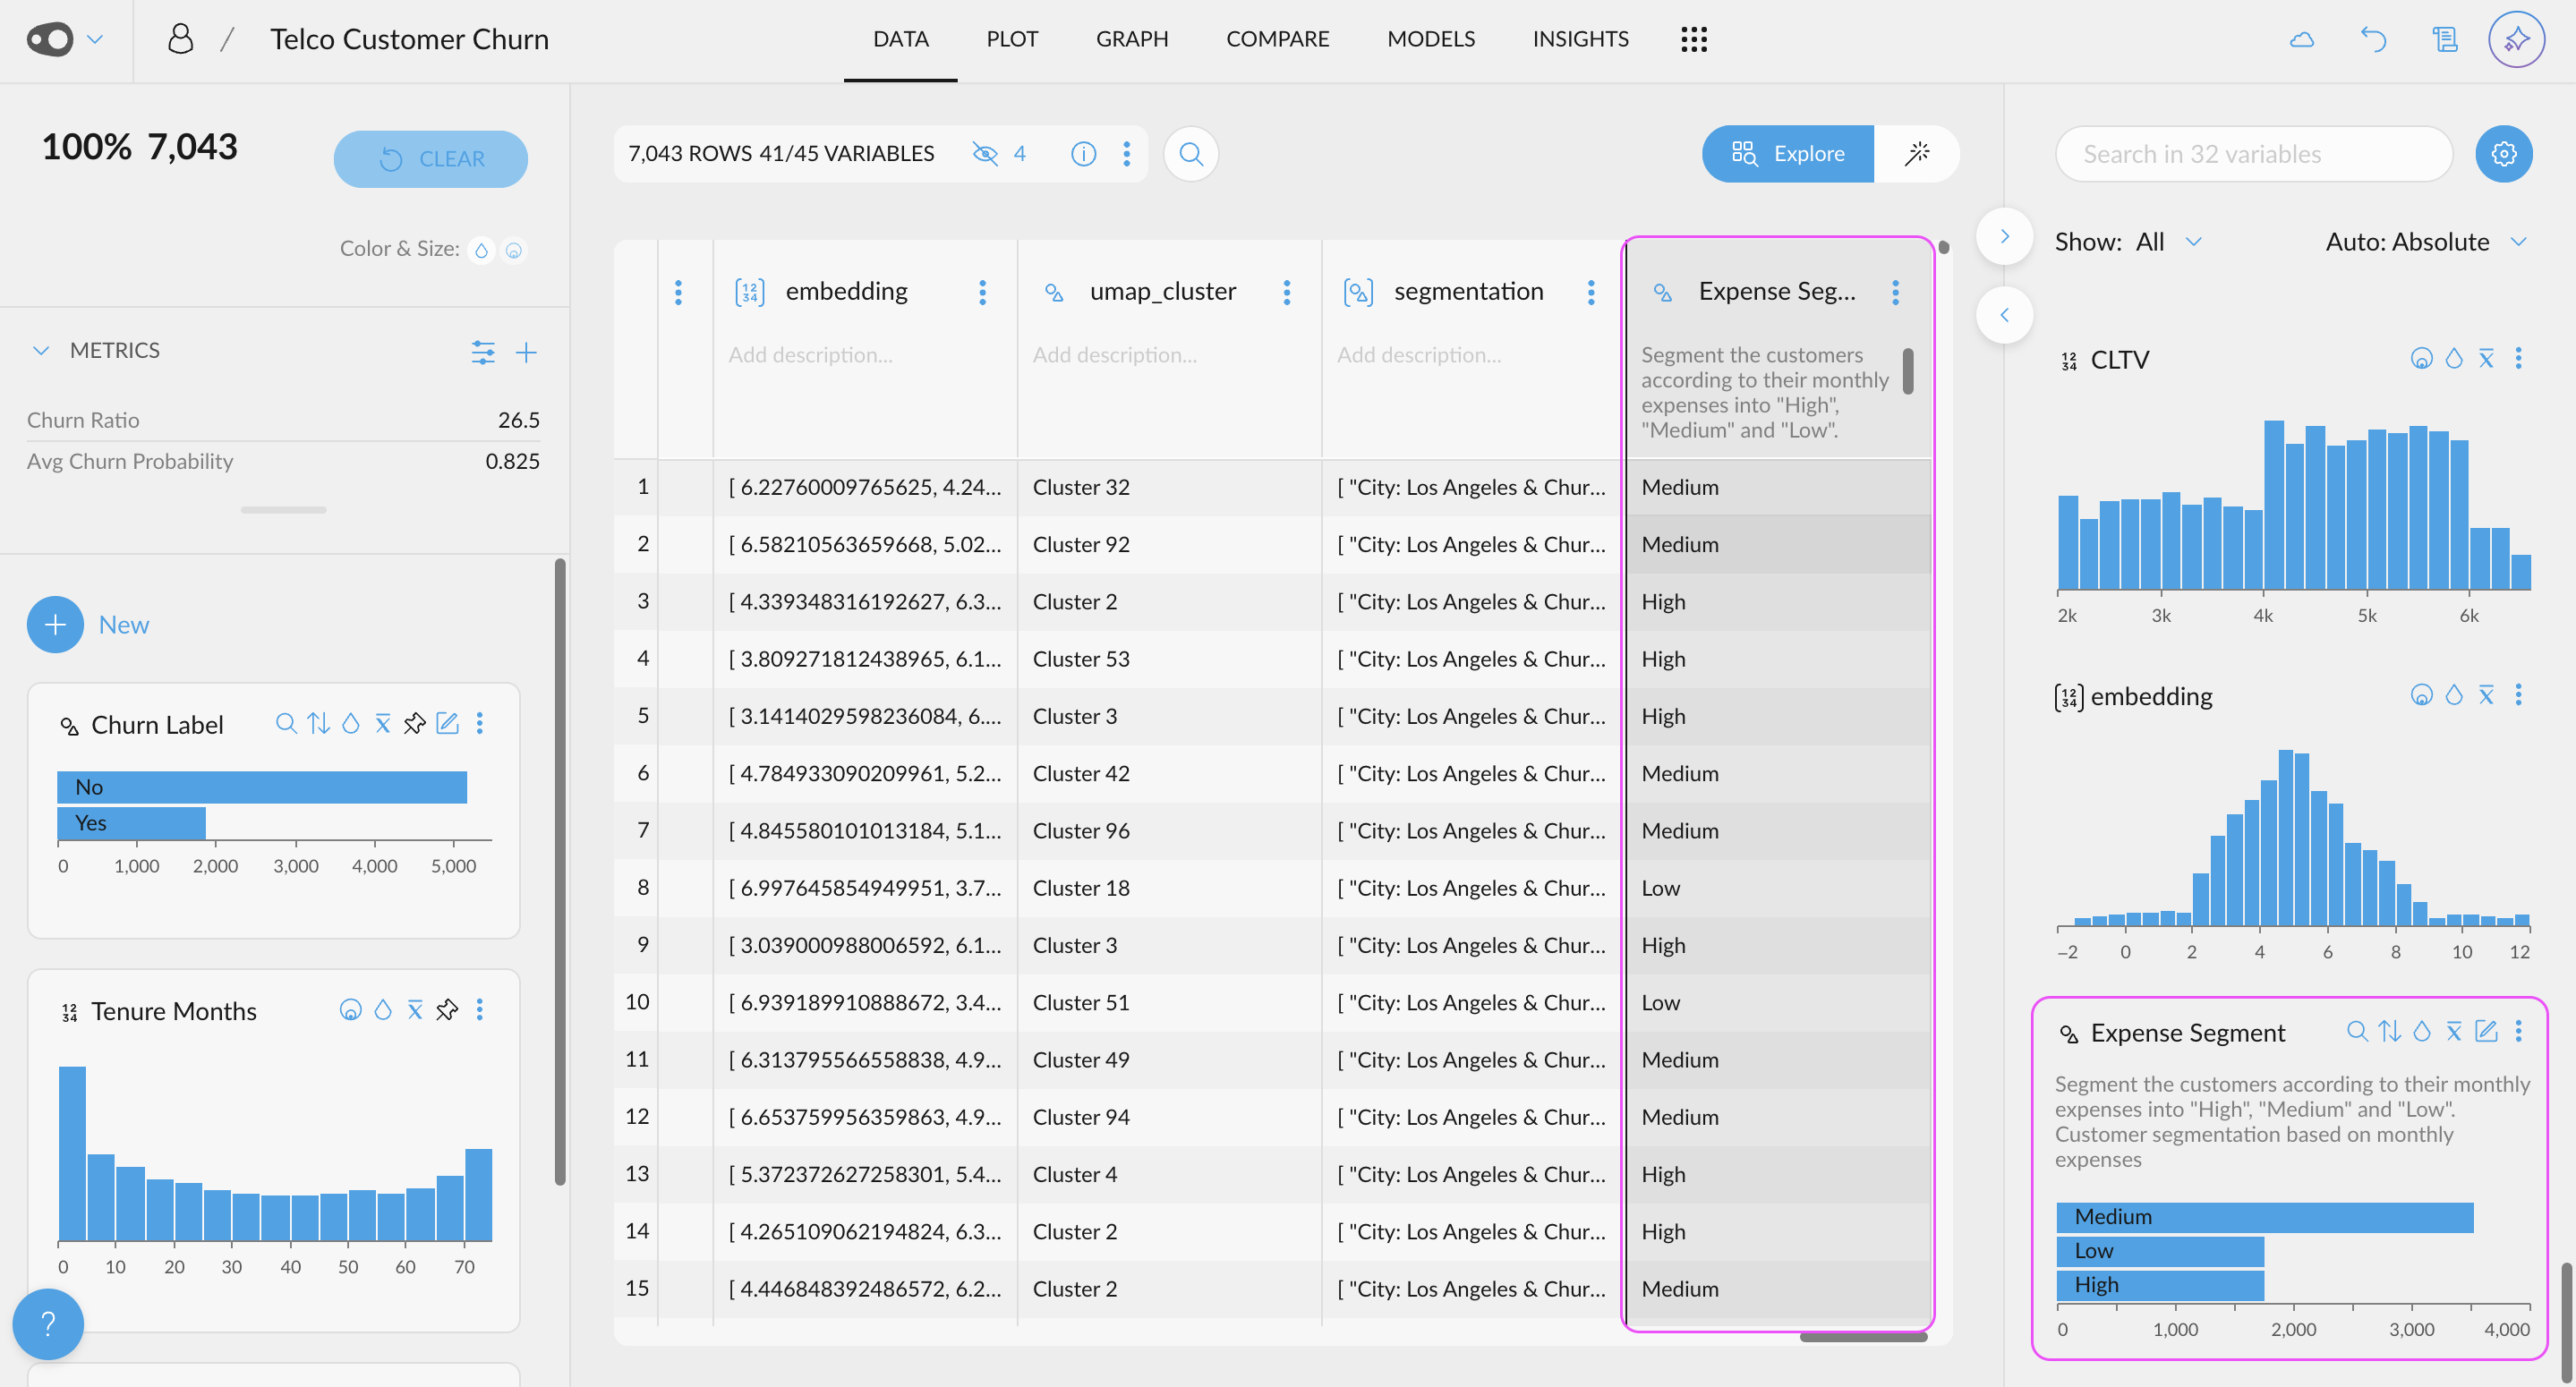
Just follow the magic star 🌟 and ask away. It will enable you to perform tasks such as extracting the name of the weekday, the month, or the time of day from a date column. We understand the challenges of working with dates in Python... That's why we have made it incredibly easy!

But that's not all. With free text, you can change variable types, perform operations between variables, create segmentations, and much more. Go ahead, give it a try, and let us know what you think.

This is just the start, we are creating a user interface powered by artificial intelligence to provide the best data analysis experience. Stay tuned!

August 8, 2023

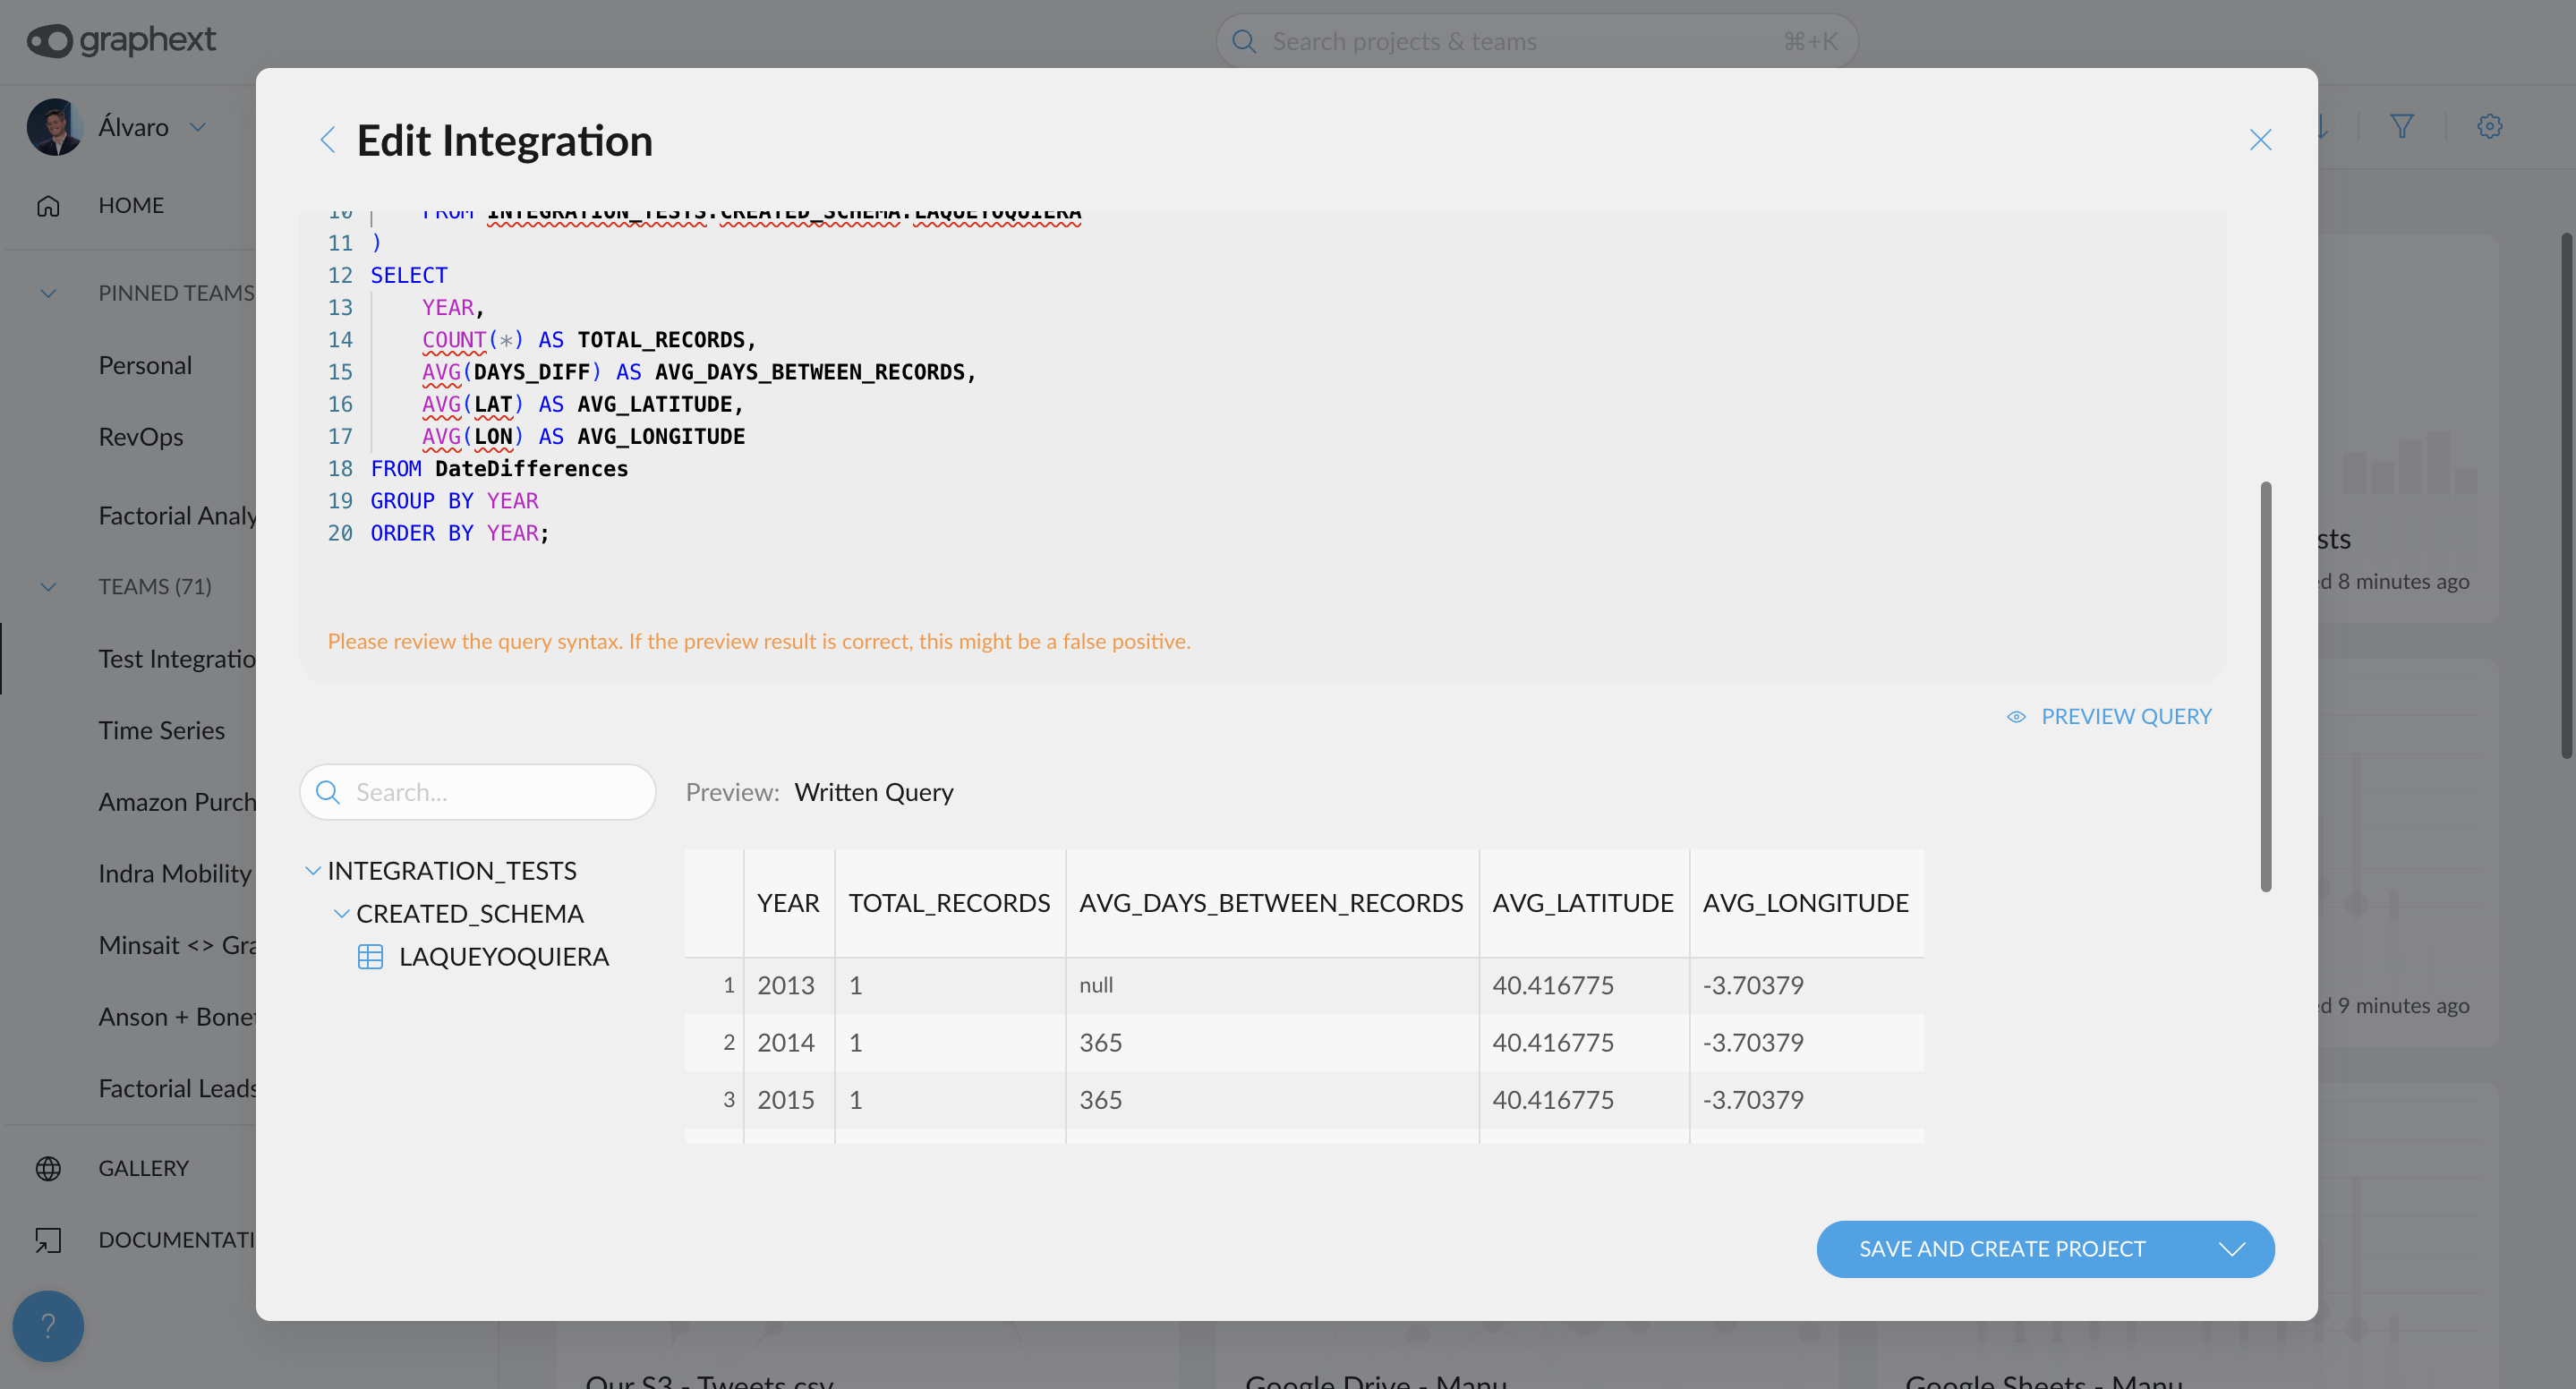
Introducing the Write-Back! Export the output of your models to any data source

Hello Graphext Users,

As promised in our last update, we are excited to roll out our new product release including the much-anticipated Write-Back functionality. Coupled with a sleek new interface, this feature aims to take ease-of-use a notch higher for all our esteemed users.

Demonstrated in the attached video, you now have the convenience to export the entirety or selected parts of your dataset to a destination of your choice, be it BigQuery, Snowflake, AWS S3, or a host of other platforms.


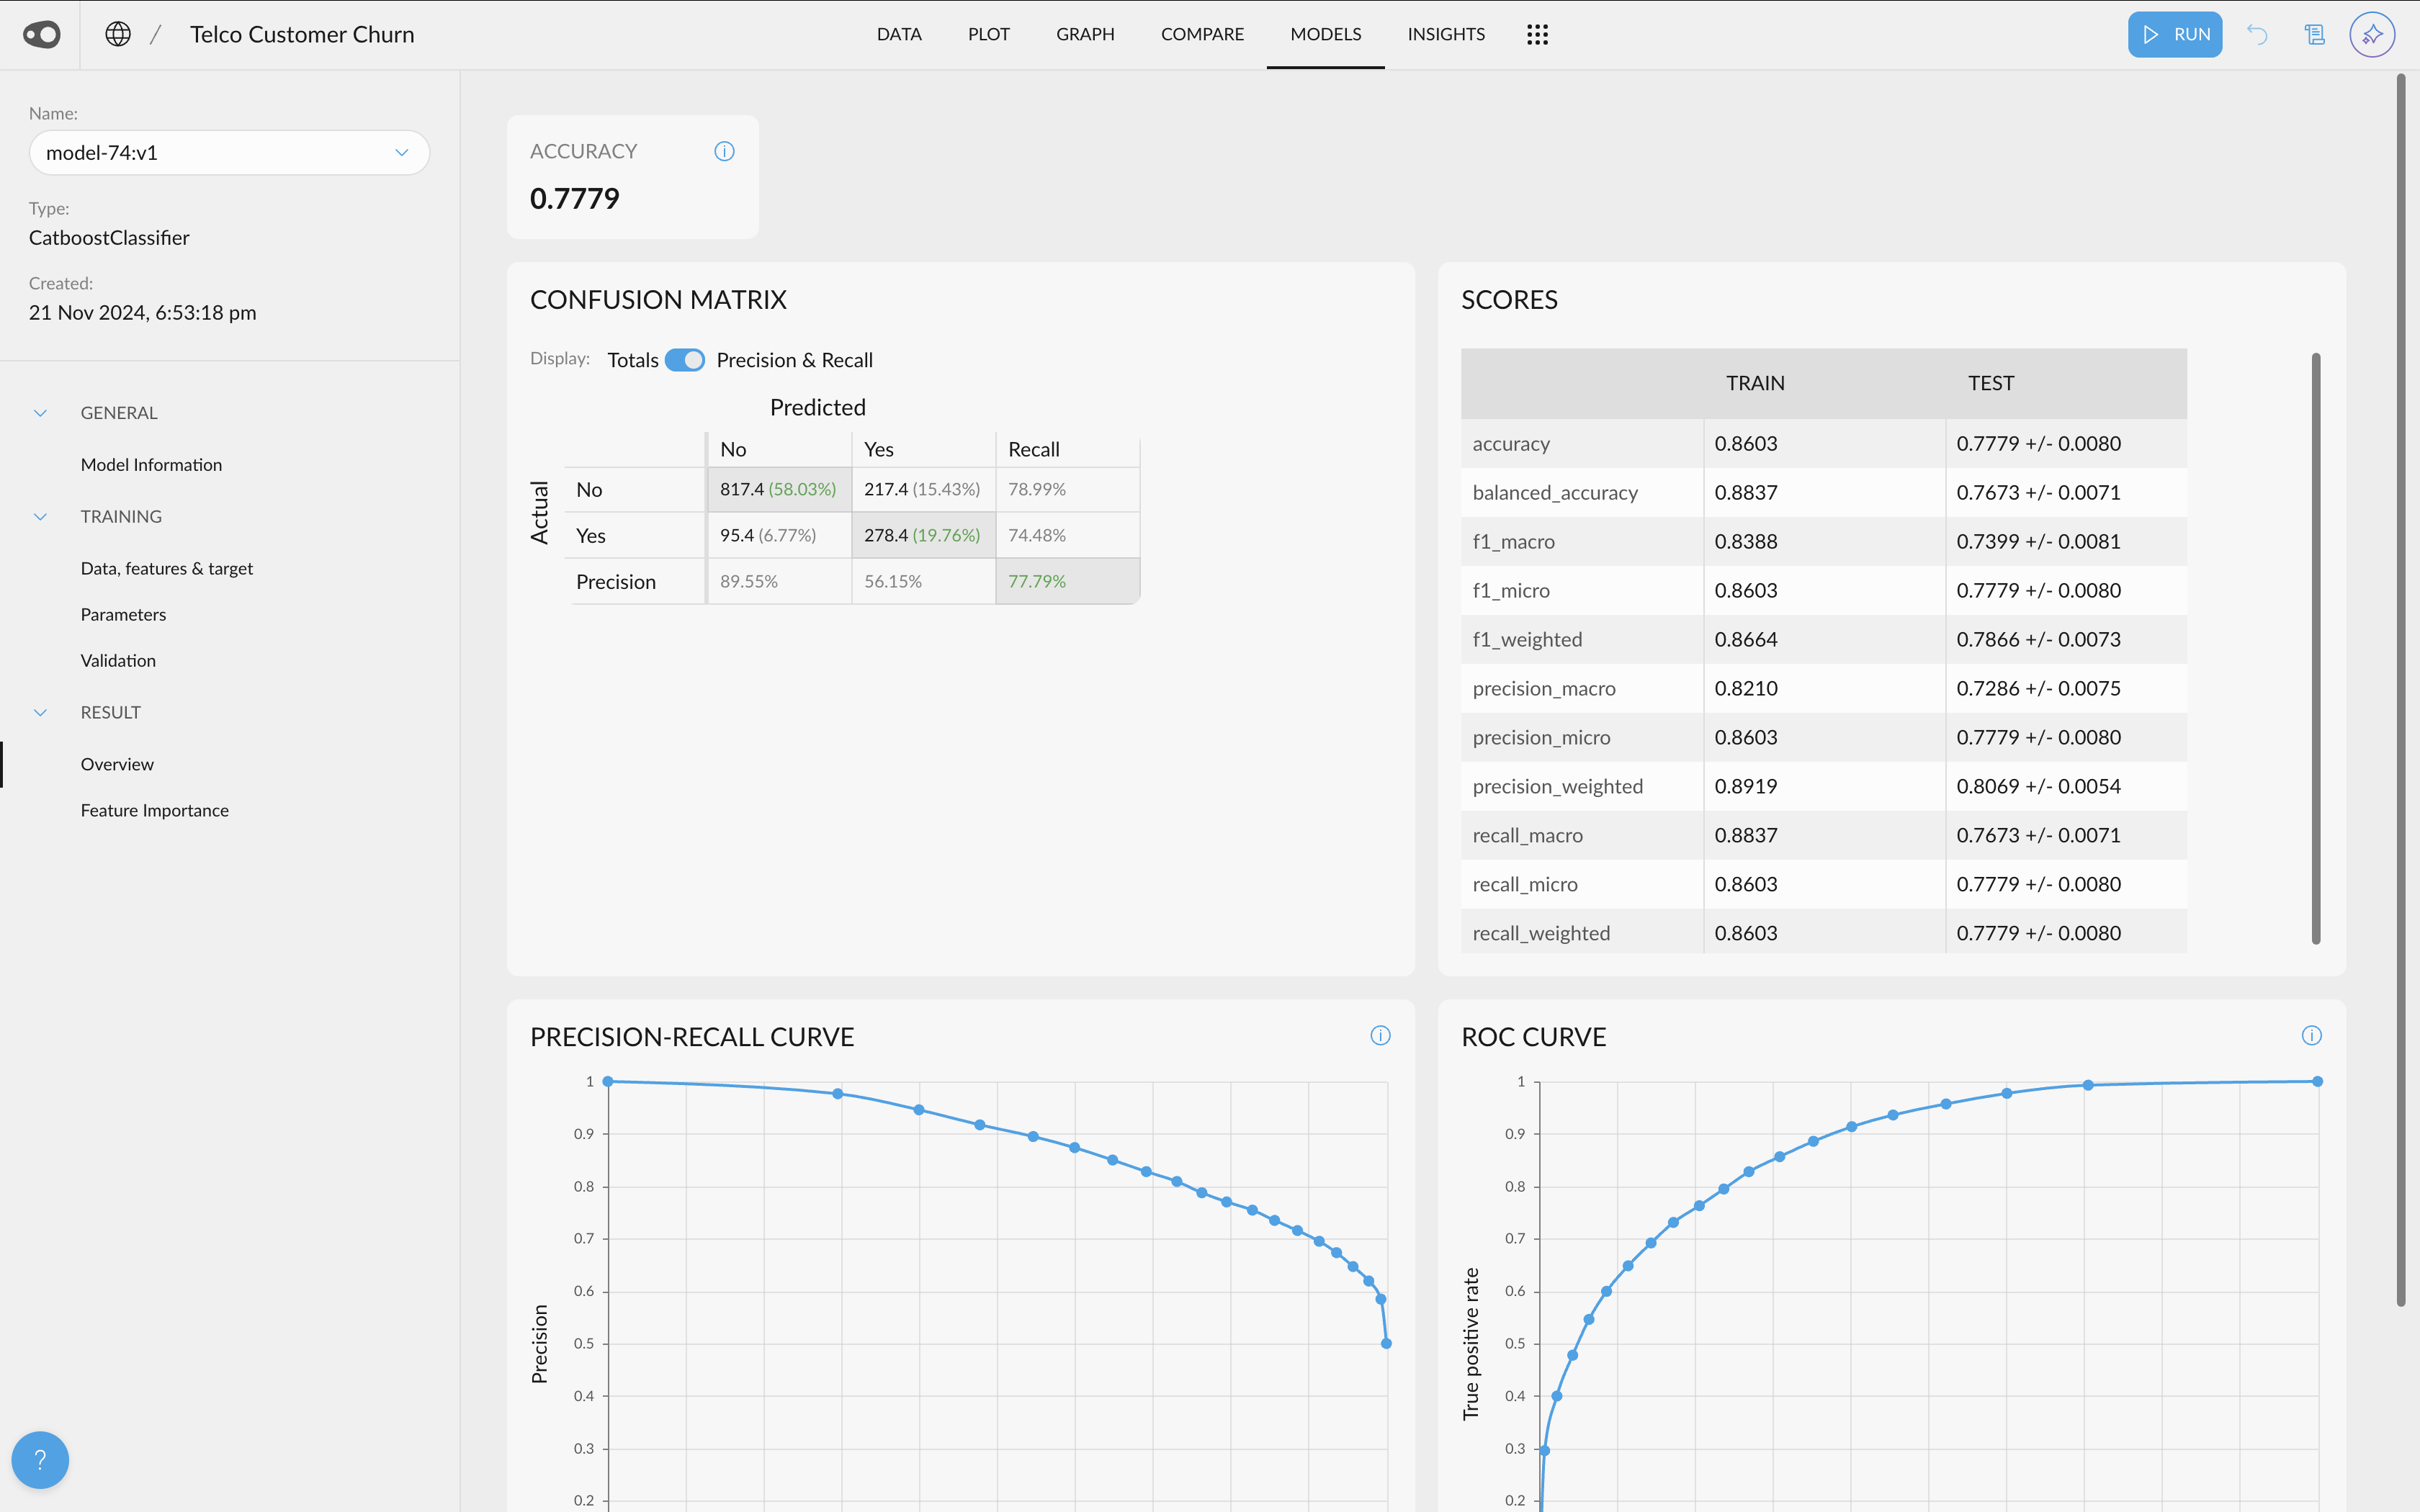
The Write-Back functionality, sewn together with our latest Recurrence feature, paves the way for a multidimensional user case scenario. What does this mean for you? With Graphext, you are now equipped to train a predictive model, leverage it to interpret new data, channel the output of this model back to the data source you prefer and set up a Daily Recurrence Schedule.

Effectively, this gives you the ability to oversee end-to-end processes not just in a more streamlined manner, but on an automated, recurring basis.

Stay tuned for more updates. Your feedback is always welcome and appreciated.

With love, the Graphext team 💙

August 1, 2023

Schedule your projects to run on a recurring basis

As the warm ☀️ summer continues, so does our commitment to improve your Graphext experience. Today, we're thrilled to introduce our latest functionality: Recurring Projects.


With Recurring Projects, you can now set up your data projects to run at regular intervals, delivering fresh data from your chosen source consistently. Imagine the power of having lead scoring models or churn prediction models in production, serving up-to-date insights every day, without the need for manual intervention. 


This feature is available to all users on our PRO plan.


But hold tight, we have more in store for you. We're preparing to launch an exciting feature soon that will enable you to write back the output of your models to your preferred data source - be it your app, website, CRM, or elsewhere. If you’d like a preview, reach out and you’ll get early access to it.


We're eager to hear how you plan to use these new capabilities. Keep exploring and stay tuned for more updates! :)

July 28, 2023

New UI for data downloading

Hi there! 

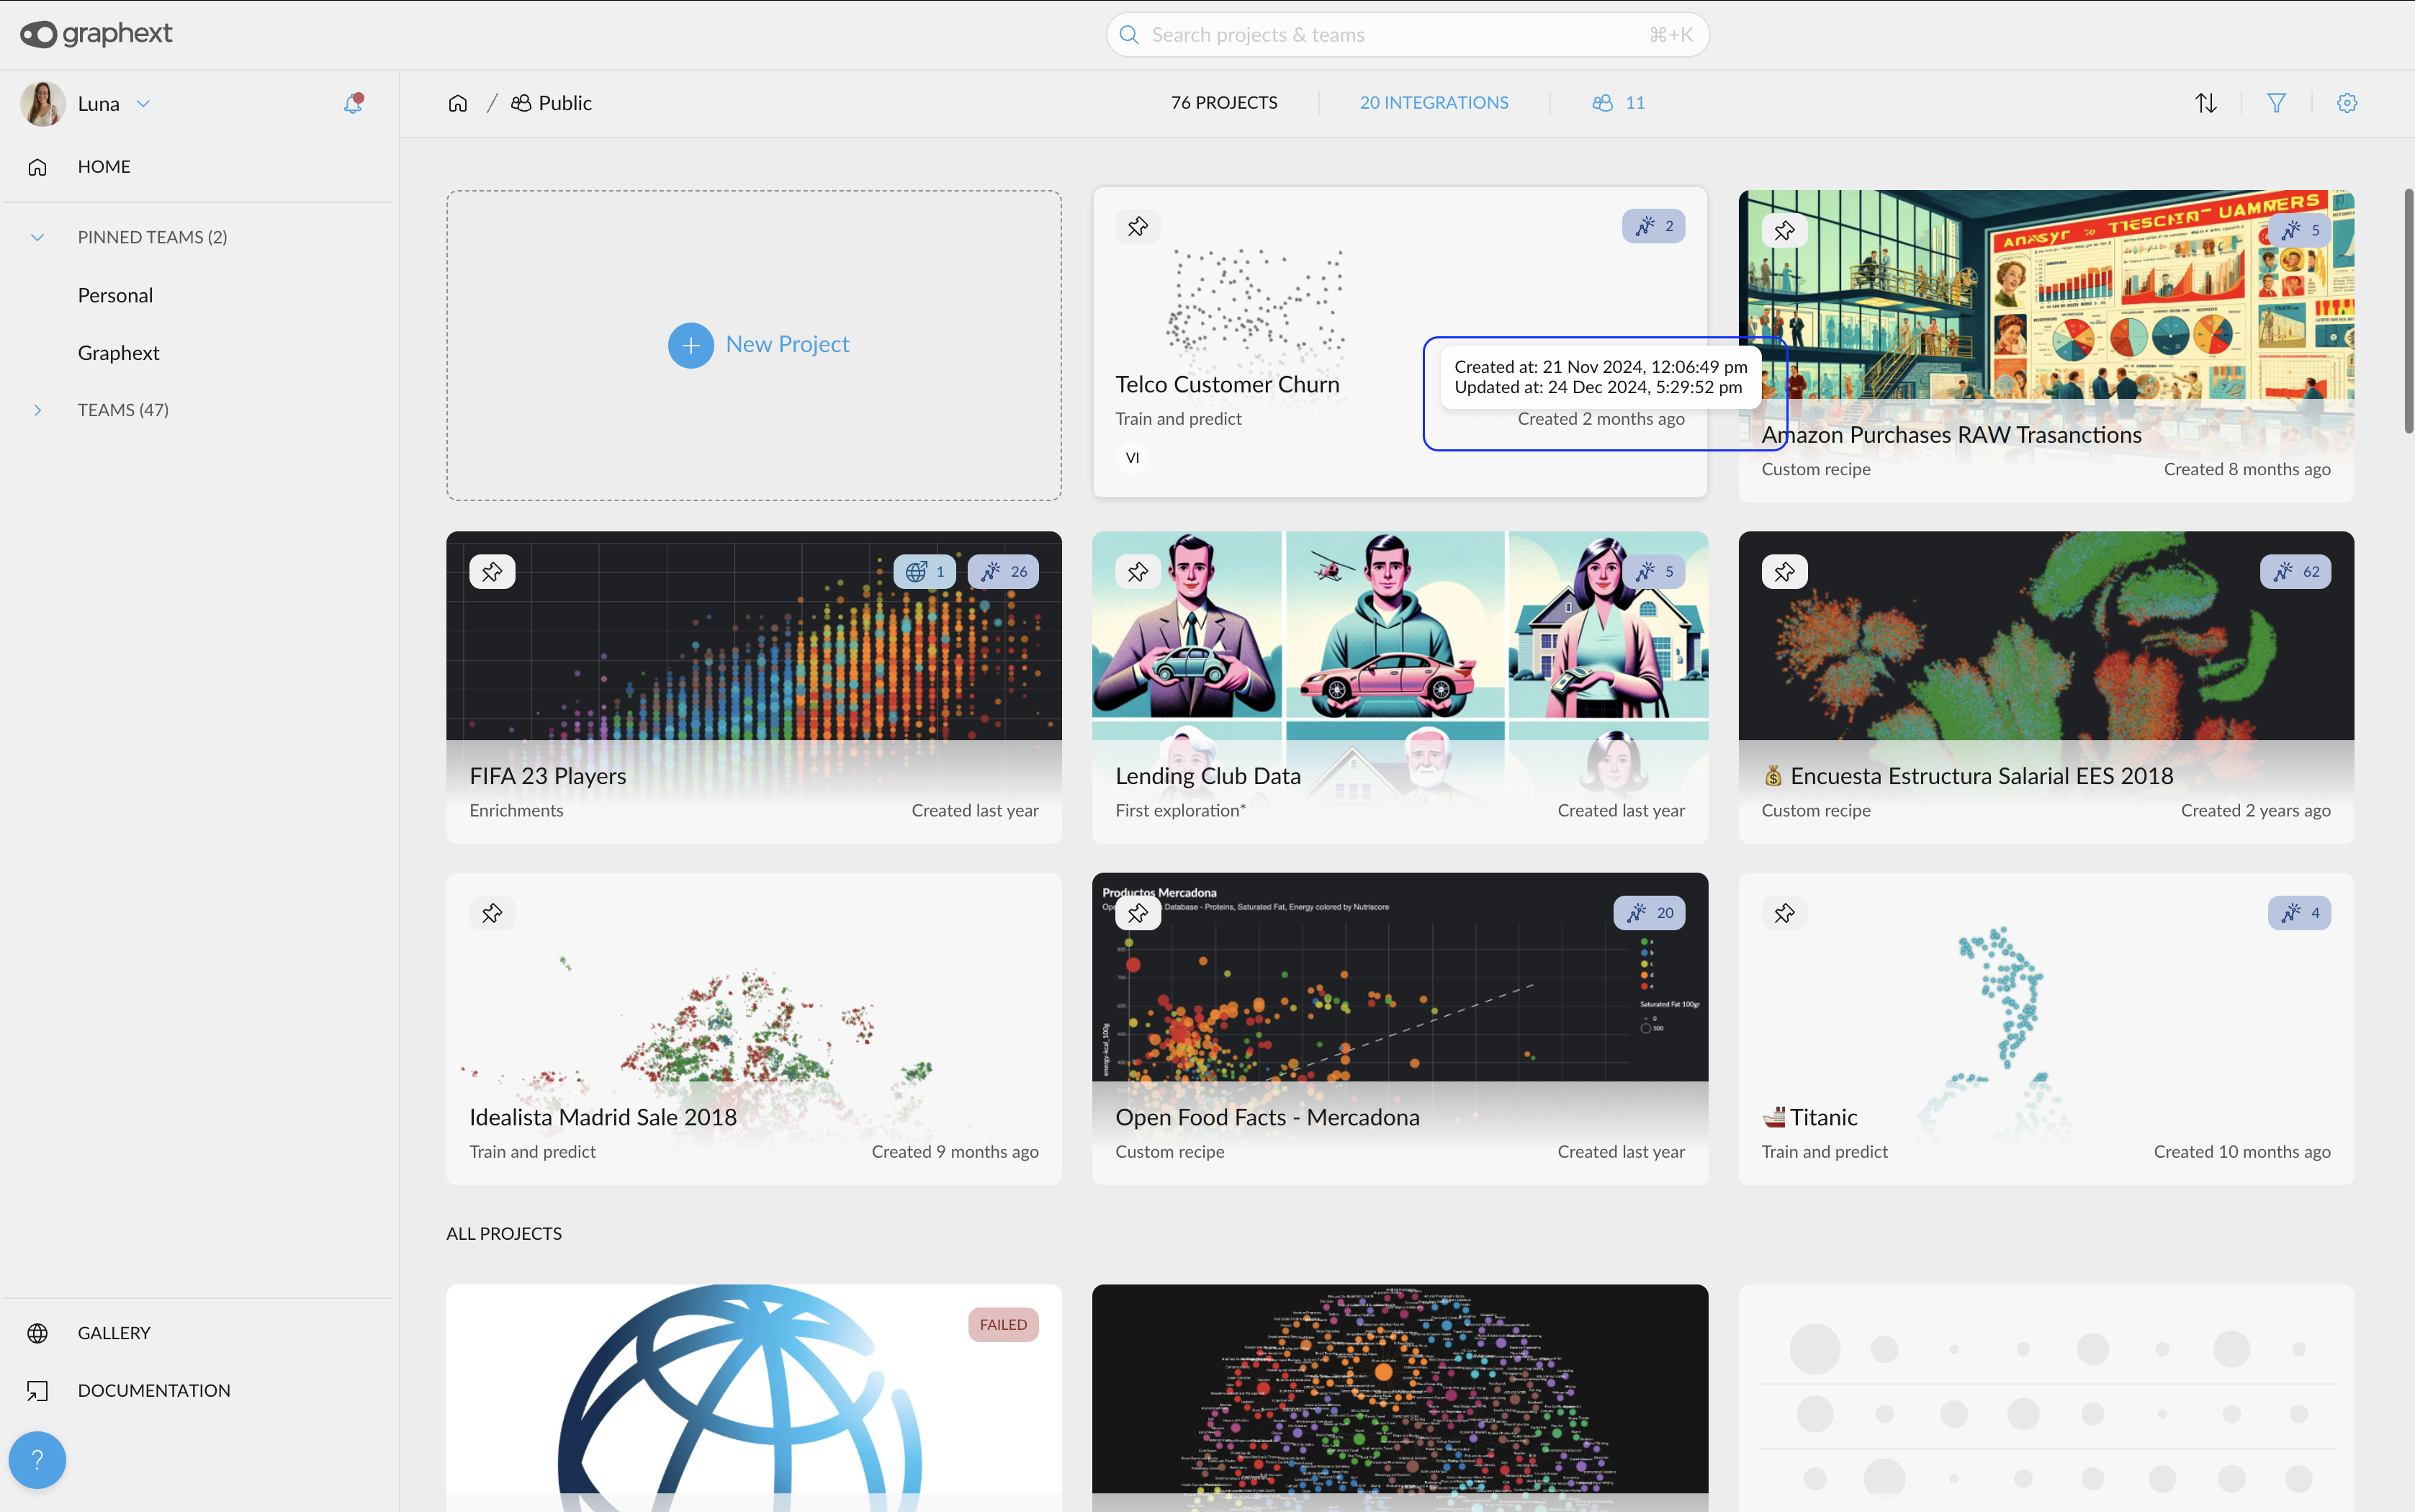
We are thrilled to announce that Graphext now offers enhanced control over dataset downloads! This super handy feature allows you to selectively download specific rows and columns, which paves the way for reduced dataset size and targeted focus on variables that are most significant to your work.

Now you have the key to tailor your downloads to fit your unique needs effortlessly, saving you valuable time and efforts. Why download irrelevant data when you can selectively pick and choose?

Stay tuned & happy analysing!

With love, the Graphext team 💙

July 18, 2023

Introducing Graphext AI Assistant for Enhanced User Support!

Hi there!

We are thrilled to announce the release of our latest addition to Graphext's toolkit - the Graphext AI Assistant! 🎉

At Graphext, our absolute focus is to deliver an exceptional user experience. We understand that finding answers to your questions within documentation pages can sometimes be challenging, and reaching out for support via chat can feel inconvenient or even uncomfortable.

To address these concerns, we have developed the Graphext AI Assistant, a cutting-edge AI-powered support chat. This intelligent assistant is trained on our extensive knowledge base to help you seamlessly navigate any doubts or inquiries that arise during your exploration journey.

However, we also recognize that there are instances where nothing matches the reassuring experience of interacting with a human. That's why our team of experts will always be readily available to assist you whenever you need that extra personal touch. 

Optimize your user support experience with Graphext AI Assistant today! We're committed to making your journey smoother, more efficient, and ultimately, more enjoyable. 

Stay tuned & happy analysing!

With love, the Graphext team 💙


July 13, 2023

Export Interactive Plots

Great news from Graphext! 

Did someone say Interactive Plots?! We’re back with another product update … and we think you’ll like this one 

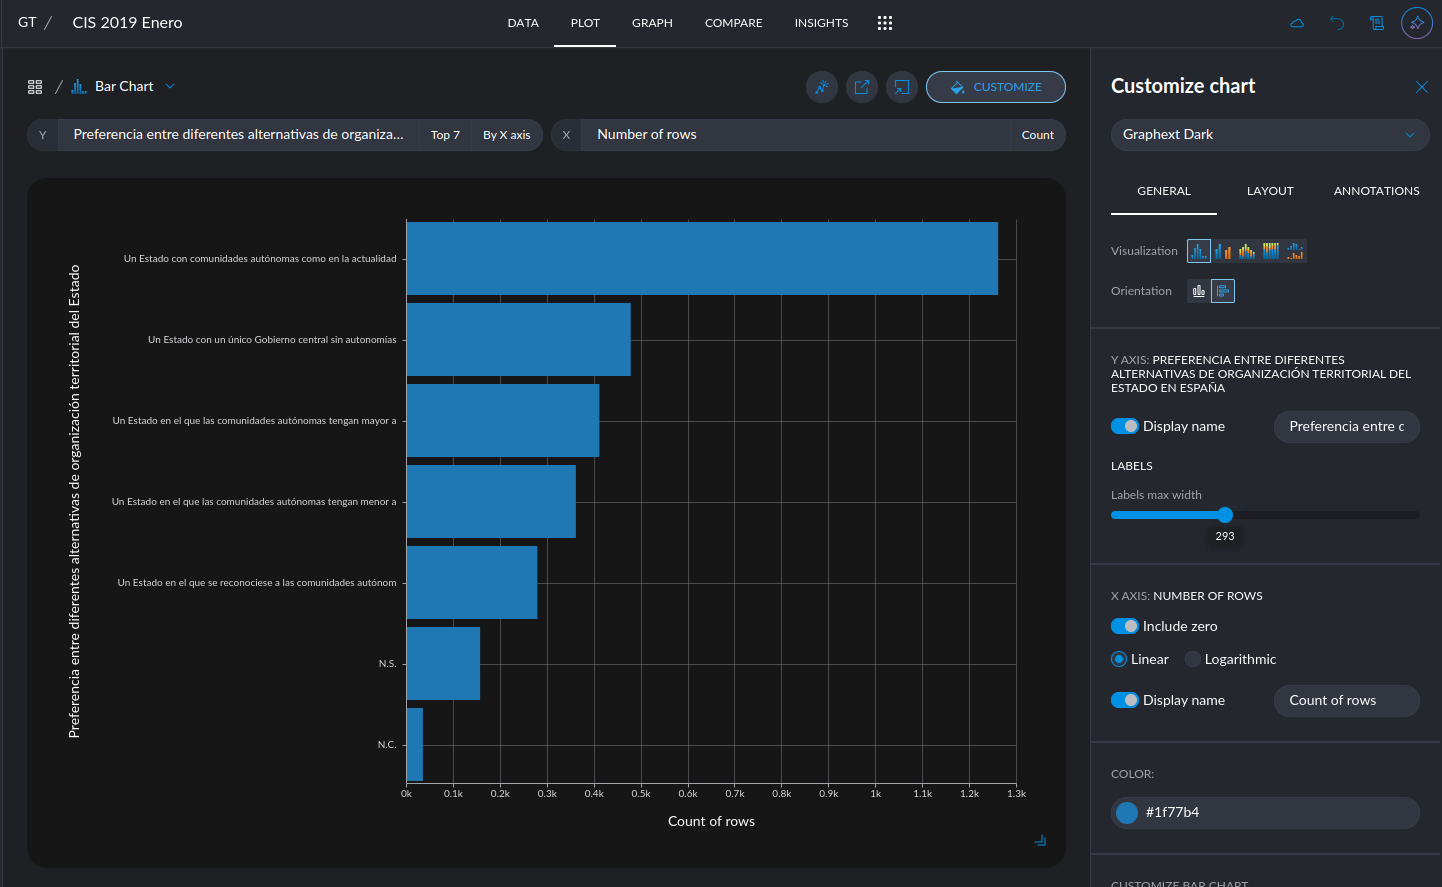
Check out how you can seamlessly embed plots from Graphext into platforms like NotionWebflow, or any other platform that support iFrames to be able to share your insights in an interactive way to make reporting and collaborating all that more efficient 

Try it for yourself and feel free to share your reports with us 

Stay tuned & happy analysing!

With love, the Graphext team 💙