April 22, 2024
Welcome to a fresh, streamlined Graphext experience! Our latest hall design is here, packed with enhancements to make your navigation smoother and your workflow more efficient. Here’s what you can look forward to:
- Left Sidebar Enhancements
- Introducing the New Omnibar
- Pin Projects Within a Team
- Improved Information Hierarchy
Left Sidebar Enhancements
- Pin Teams: The left sidebar now allows you to pin your favorite teams for quick access, ensuring that you can easily navigate to the teams that matter most to you.
- Full Team Names: No more guessing or truncated names—the sidebar now displays the full names of your teams, making it easier to find exactly what you're looking for.
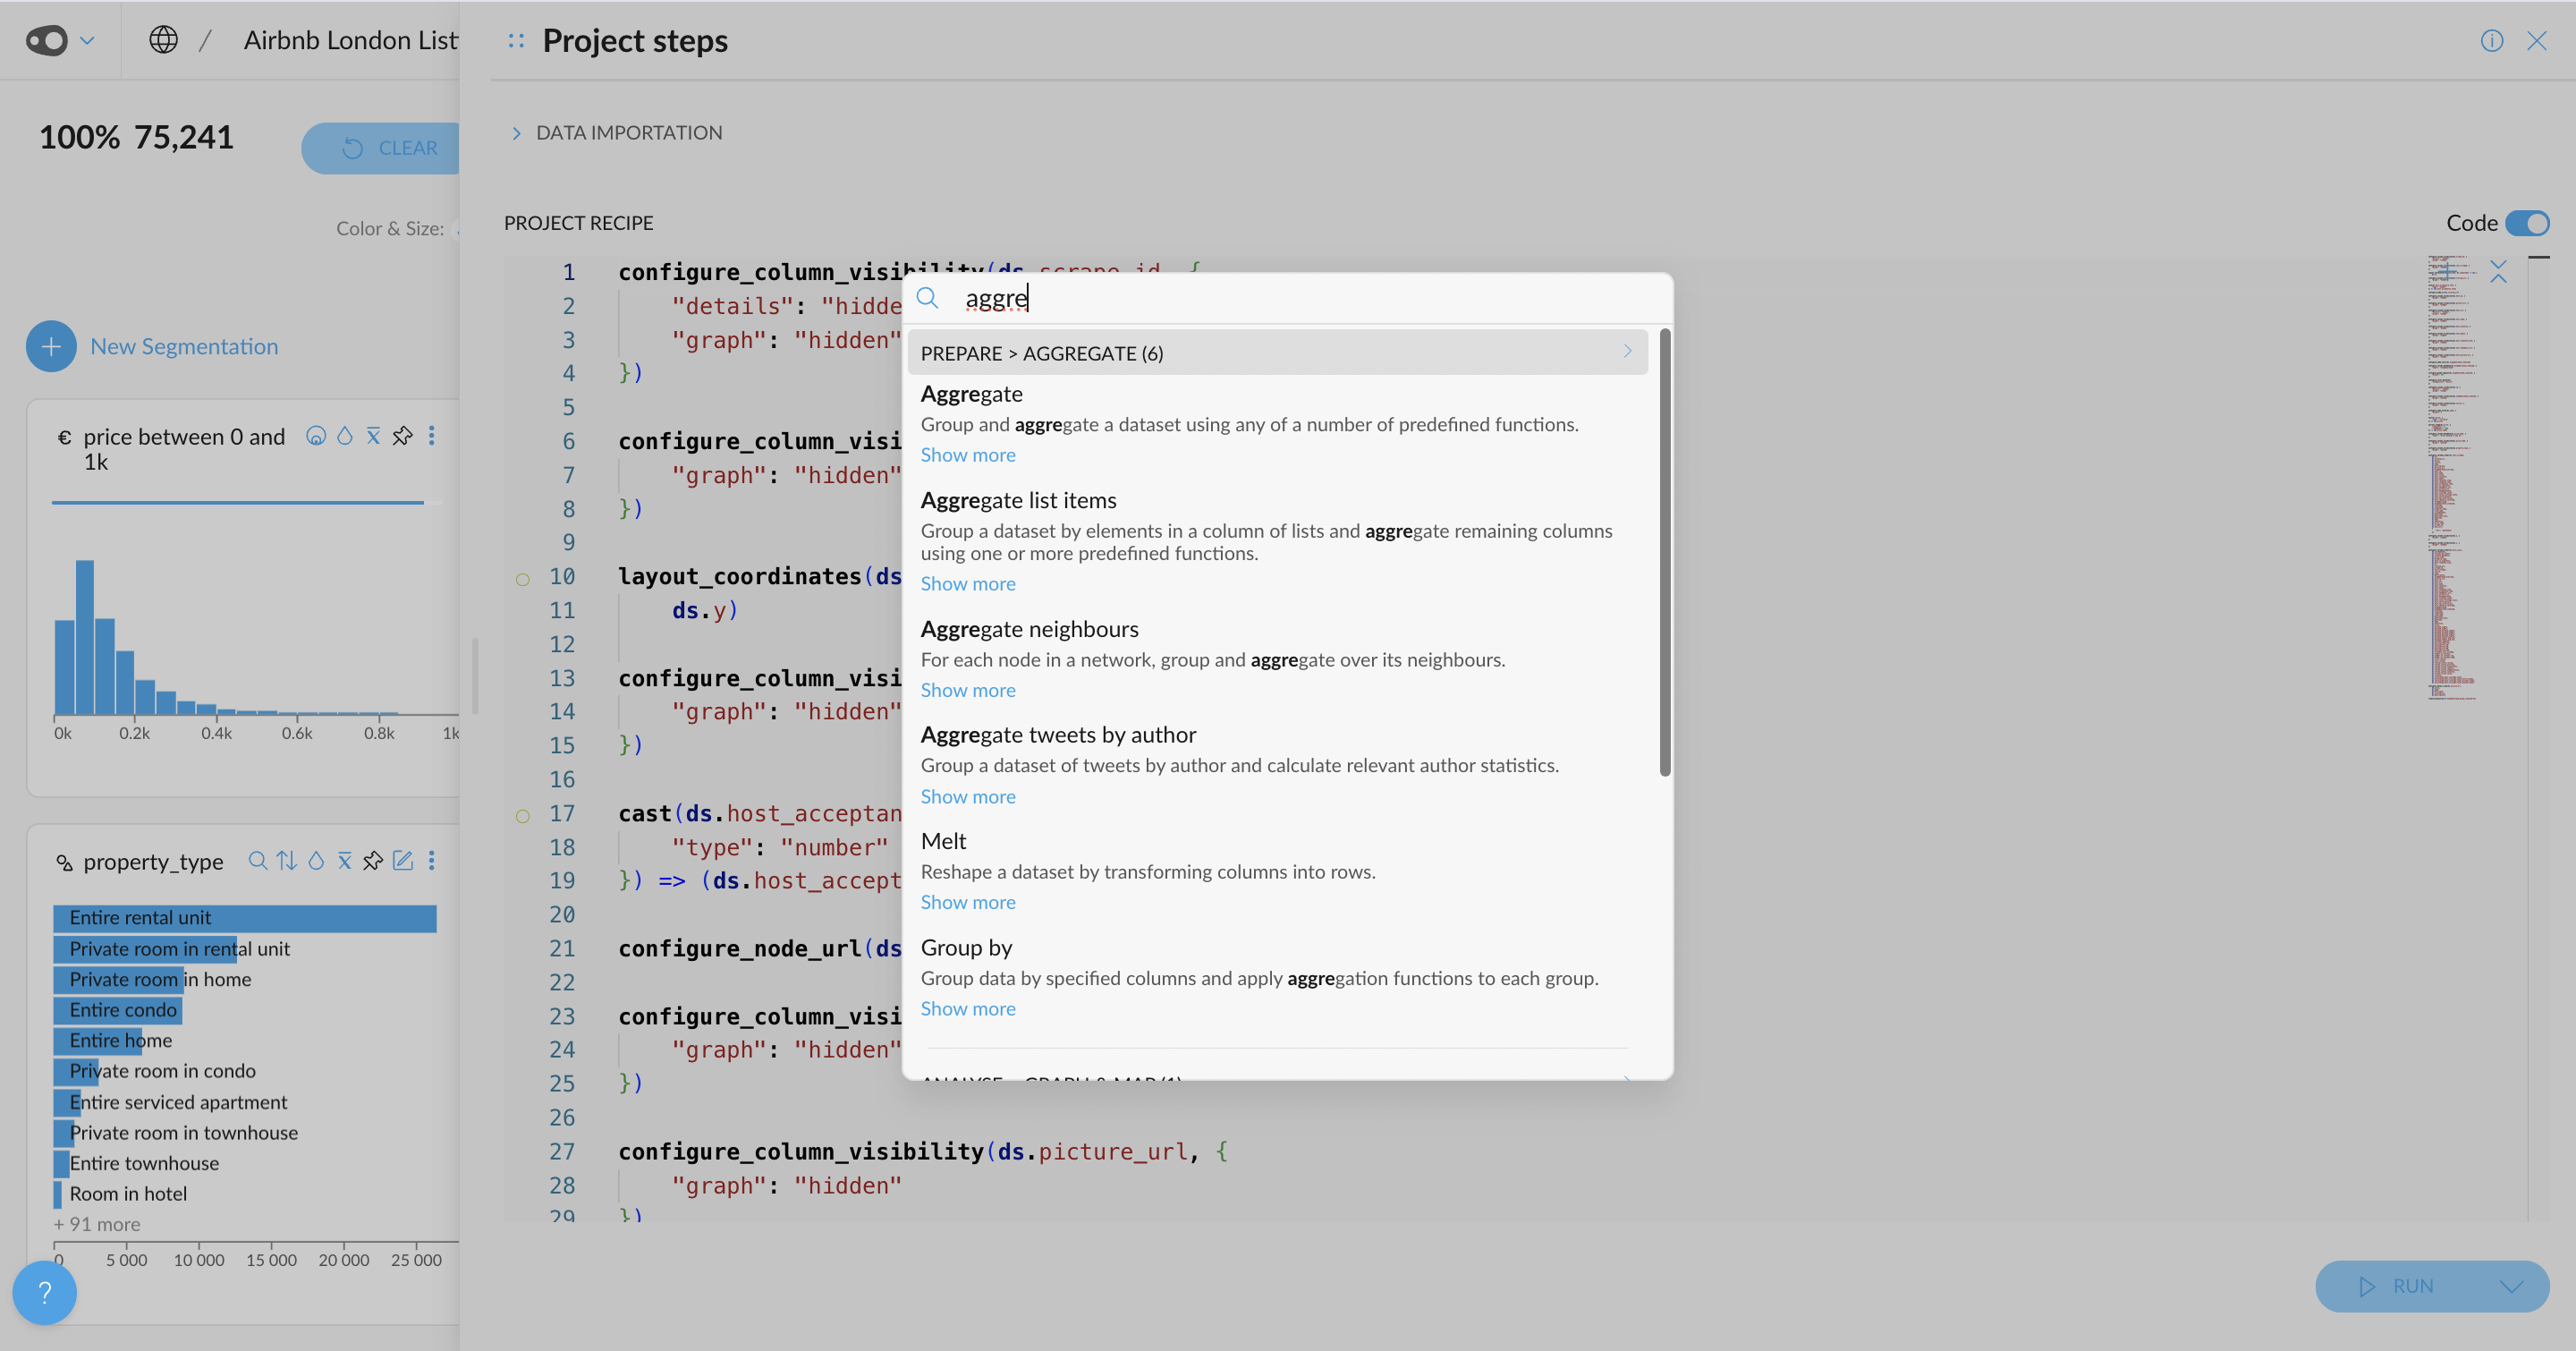
Introducing the New Omnibar
- Search Functionality: Our new omnibar allows you to search for both project and team names, streamlining your workflow and saving time.
- In-Project Availability: The omnibar is also available inside projects, enabling you to switch from one project to another without needing to visit the hall, keeping your focus where it needs to be.
- Quick Access Shortcut: Access the omnibar quickly using the shortcut Cmd+K on Mac and Ctrl+K on Windows.
Pin Projects Within a Team
- Project Pinning: You can now pin specific projects within a team, giving you quick access to the projects you work on the most and ensuring a more organized workspace.
Improved Information Hierarchy
- Sidebar Organization: The sidebar has been restructured to present information more clearly, helping you find what you need with ease.
- Team View Clarity: We’ve refined the hierarchy of information in the team view, giving you a better understanding of the team you are in, the available integrations, and the members of the team.