

The Method Behind Our Investigation of Reports of Adverse COVID-19 Vaccine Events
Taking on an investigation into the adverse reactions associated with the COVID-19 vaccination rollout in the USA, our team were aware of the increased need for transparency whilst conducting our analysis. This article documents the methodology behind our study of Vaccine Adverse Event Reporting System (VAERS) data.
Here's the write up of the COVID-19 adverse events investigation we conducted using VARES Data.
Working with VAERS Data
Who are VAERS
The primary aim of the Vaccine Adverse Event Reporting System (VAERS) is to monitor and detect the effects of vaccinations programmes in the USA. They record patient-level data on the vaccination received by a person alongside adverse symptoms that they report.
Established in 1990, VAERS is co-managed by the Centers for Disease Control and Prevention (CDC) and the Food and Drug Administration (FDA), both agencies of the US Department of Health and Human Services.
Adverse Events in Context
VAERS data records "adverse events and reactions that occur following vaccination". It's important to note that VAERS data does not represent everyone that has received a vaccination in the USA. Instead, each row in the data documents a person suffering an adverse effect following a recent vaccination.
As a result, if we are to assume that each of the 182,559 entries in our dataset represents one instance of a vaccination given to a unique individual, then the total entries in the dataset would refer to just 0.07% of the 277 million vaccine doses given in the USA at the time of writing (20th May, 2021).
The Data Collection Process
VAERS data is based on a system of reporting. Reports can be made by individuals suffering vaccine reactions or by healthcare providers on behalf of their patients. Anyone can submit a report to VAERS but healthcare providers are either required by law or strongly encouraged to report vaccine adverse effects.
This does not, however, mean that all adverse vaccine reactions are reported to VAERS. Research published in "Vaccine" documented a 2005 survey finding that "37% of healthcare providers had identified an adverse event following immunization, yet only 17% of those indicated they had ever reported to VAERS".
VAERS data is based on a system of reporting. Healthcare providers, vaccine manufacturers, individuals and carers are encouraged to make reports to VAERS.
Although the context of the pandemic's vaccination rollout is likely to be significantly different, with VAERS and CDC repeatedly pointing towards the issue of underreporting it would be fair to assume that not all vaccine adverse reactions are represented in the dataset.
A Sample of VAERS data | 2021 Wave
The embedded CSV file below shows a sample of all columns inside the dataset we used for this study. The sample represents VAERS data after our team had joined cleaned and pre-processed the original data. Data in this sample accounts for just 19% of the data used in our study and should not be taken as representative of the most recent publication of VAERS data.
Accessing the Data
VAERS regularly update their data on adverse vaccine events reported to them. The latest date included in the data is well documented on the VAERS data page. The 2021 wave will typically include data recent to approximately 2 weeks.
The three CSV files provided by VAERS contain specific information about different aspects of a person's vaccination. The first file, VAERS DATA, contains information about the person, their medical history, their symptoms alongside other information included in the report that they submitted to VAERS. The second file, VAERS Symptoms, contains more precise information about the symptoms. The third file, VAERS Vaccine, contains information about the vaccination dose given to the person.
In the data studied in this project and in the sample data shown above, our team joined the original VAERS files. Check out our notebook to follow or reproduce how we did this.
Download the most recent VAERS dataset here.
Limitations of VAERS data
Alongside the issue of underreporting mentioned above, data collected by reporting systems have other limitations that VAERS draw attention to. Importantly the quality of the data is completely dependent on the people reporting on adverse vaccine events. This not only means that the accuracy and amount of information can vary significantly between reports but also that reports can be affected - and in some cases driven - by outside events such as increased media coverage of medical outcomes.
It is also important to recognise that VAERS data is unable to determine causal relationships. There are many possible explanations as to why a person suffered the symptoms described in VAERS data including the influence of any existing health conditions a person has as well as any medication they take. Simply because symptoms follow a vaccination does not mean that they occurred because of it.
"VAERS reports alone cannot be used to determine if a vaccine
caused
contributed
VAERS, Data Disclaimer
Bearing in mind the limitations of VAERS data, the service claims to be most relevant in the case of "newly licensed vaccines" where it can "generate signals that trigger further investigations". Since the vaccination efforts against COVID-19 are happening at a rapid pace with a number of newly licensed vaccines, there are a number of ways that VAERS data can be used to particularly good effect.
An Important Disclaimer on Mortality and Recovery Rates
In recognition of the inability of VAERS data to determine adverse vaccine event causality, it is important to note that the mortality and recovery rates presented in the data and inside our study do not claim to represent people that have died as a result of being given a vaccine.
Instead these figures show that people have died or failed to recover from their symptoms following their vaccination. Although the findings put forward by our team have been carefully considered, laboratory tests should be conducted in order to determine whether vaccinations actually caused a death or set of symptoms.
Since there is a lack of an unvaccinated group to compare VAERS data with, the findings presented in our study can only represent hypothesis for further investigation. These hypothesis can be examined using studies conducted with vaccinated and unvaccinated subjects.
Preparing the Project
Joining the Data
After downloading the 3 data files from the most recent publication of VAERS data - including data on vaccinations given up until the 5th May 2021 - our team set about joining the files so that we could work with just one dataset that gathered together all information about the person, their symptoms and their vaccine dose.
First, using the VAERS Symptoms dataset we extracted a list of symptoms for each VAERS_ID. Next, we extracted information on the manufacturer, route and dose number of every dose of the vaccine given in the data using the VAERS Vaccine file. This gave us all of the additional information about each VAERS_ID entry that wanted to study.
To join our the data, we used the VAERS_ID column to merge each data frame containing additional information to the central dataset containing all information in the VAERS Data dataset.
Cleaning the Dataset
Next, we dropped columns from the data that we felt were extraneous to our study. These included variables on the date a patient recovered, whether they have a birth defect and whether they visited a hospital's emergency room or not. More often than not, the columns we removed were lacking a substantial number of values and were, therefore, less useful to our analysis.
After consulting with the VAERS Data Use Guide, we renamed the columns in the data frame so that they more clearly represented the actual values they referred to.
Inspecting the values in columns 'Disabled', 'Died', 'Life-Threatening Illness' and 'Hospitalized', our team perceived that these columns should contain booleans representing true, false and perhaps even unknown values. However, there were only values in these columns when the outcome was true - or coded as 'Y' in the data. In order to work with these columns in Graphext, we preferred to have values in these columns.
As a result, we decided to enter a 'Not Reported' value for each row in the data belonging to one of the above columns and where a 'Y' - or true - value had not already been reported. Finally, we exported the transformed data to a CSV file and uploaded it to Graphext.
Variable Types
After uploading the dataset to our Graphext workspace, the team inspected the variable types automatically recognised by Graphext. Most types were correctly inferred but we had an issue with 5 categorical columns; Other Medication, Allergies, Prior Vaccinations, Current Illnesses and Medical History Notes. These columns contained notes from the original VAERS report submitted either by an individual or by a healthcare provider.
The notes provided in these columns have varying degrees of structure but are generally untidy and difficult to work with. Instead of keeping them as categorical variables that we could use inside our model, the team decided to set these as Text variables and use some NLP to extract the features of values in these columns.
Setting Intentions
With the dataset ready to work with, we removed all sampling so that we could work with the full dataset and turned our attention to considering the kind of analysis we wanted to conduct.
Our instincts told us that the two columns most crucial to gain a deeper understanding of were Recovered and Died - both indicators of the severity of the symptoms suffered. With values like Age, Sex, Symptoms, Life-Threatening Illness and Vaccine Manufacturer in the dataset alongside information on a person's location, our team started to feel that an appropriate analysis would be to cluster rows based on the similarity of their values for each of these key variables.
The idea in clustering the data was to draw out patterns in the data using the Graph - or network visualization. If there were any relationships between our key variables and either recovery or mortality - then our Graph would represent these relationships visually.
Building the Project
Clustering
Clustering involves grouping data according to the similarity of features. In the context of this project, we wanted our clustering model to group reports of adverse vaccine events according to the similarity of the symptoms shown, the demographics of the person suffering the adverse event and the details of the vaccination itself.
The intention of doing so was to understand why recovery or mortality rates might vary between clusters. Do the defining features of a cluster ultimately impact mortality or recovery rates following a COVID-19 vaccination?
The team started building our clustering project with Graphext's setup wizard using the Models → Cluster flow.
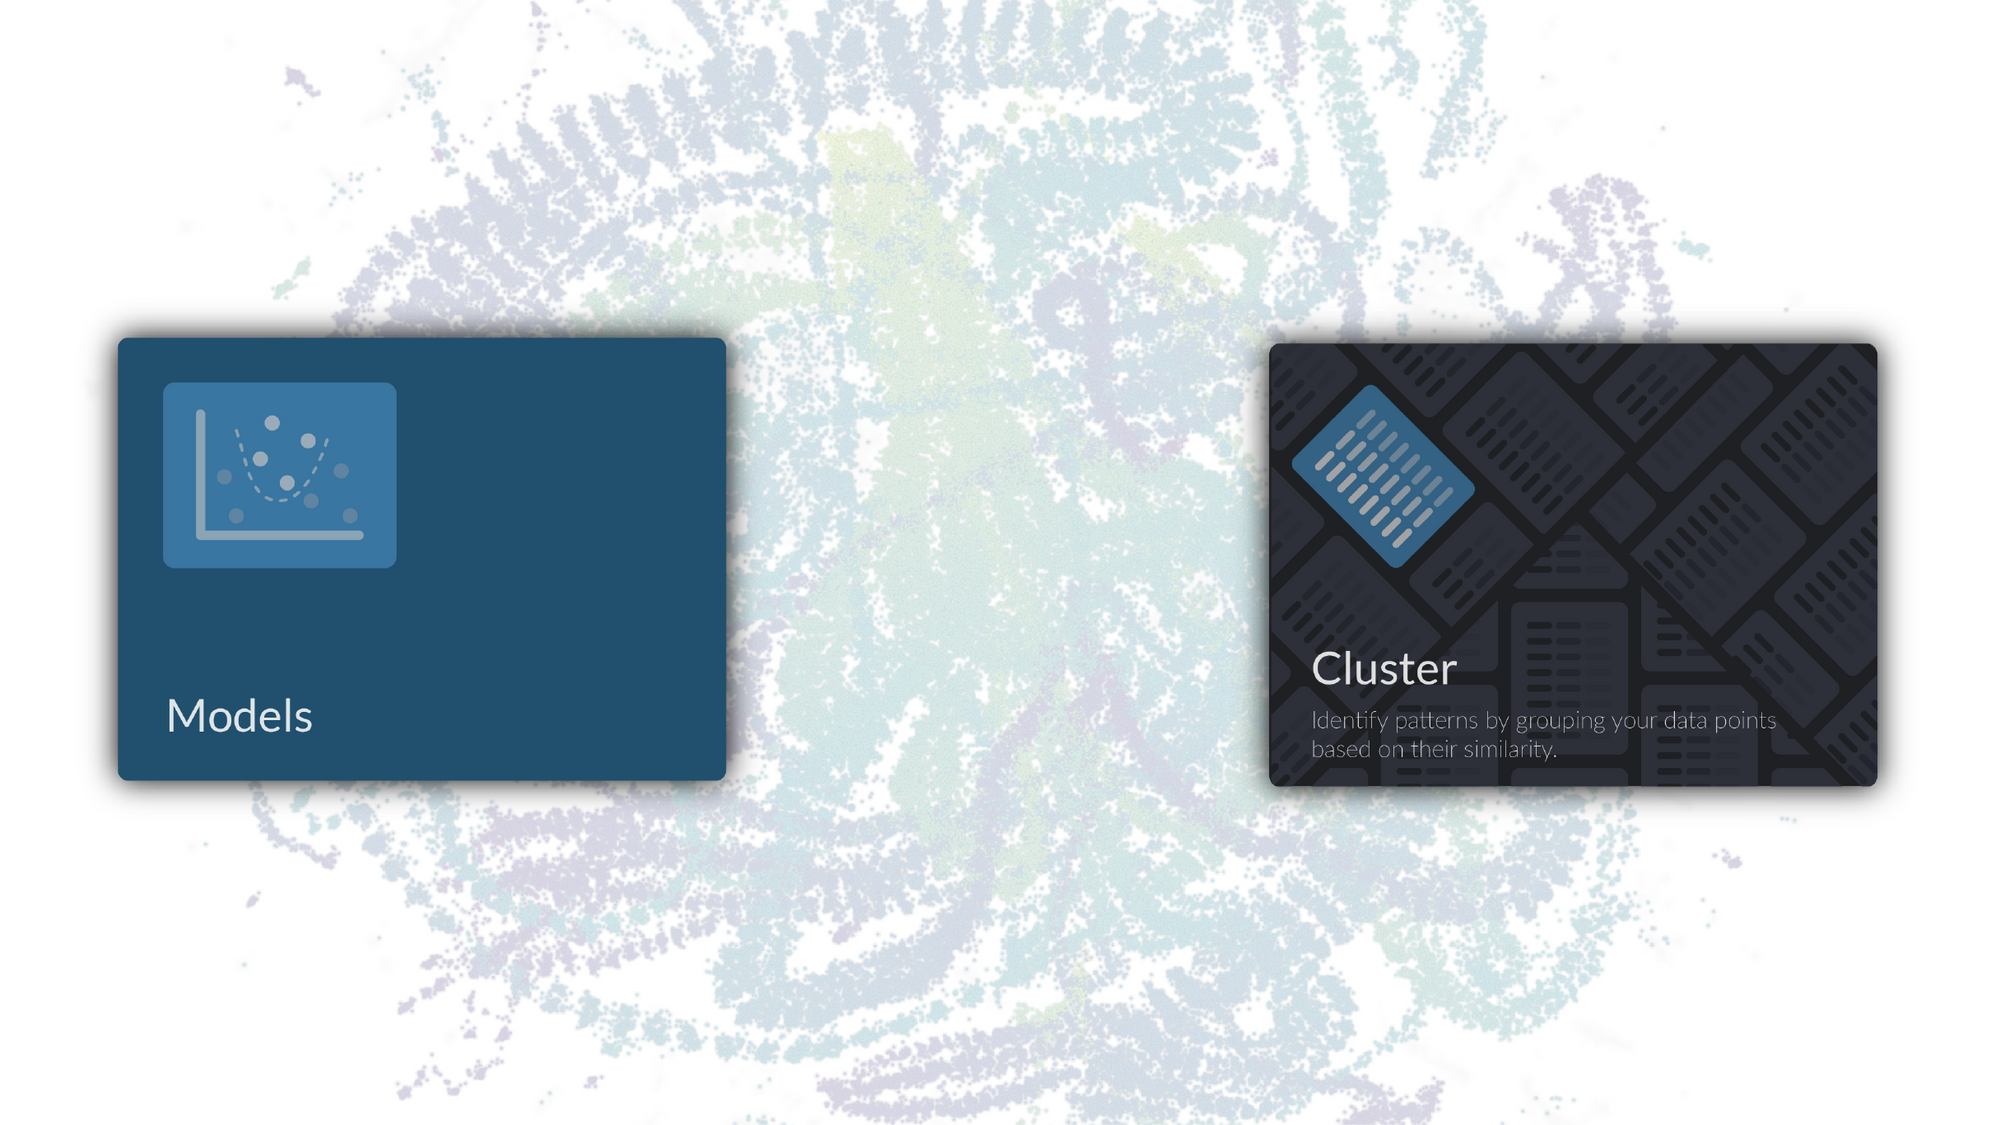
We chose Models -> Cluster as our analysis type.
Targets and Factors
Clustering models are a powerful technique used to represent relationships in data. To understand how to define these relationships, we have to tell models which features of a dataset to use in order to interpret these relationships. We do this using targets and factors.
Targets | The variables we wanted to gain a deeper understanding of.
Died, Recovered
Factors | The variables our model used to cluster the data.
Age, Sex, Life-Threatening Illness, Hospitalized, Disabled, Facility Type, Symptoms, Dose Number, Manufacturer, Route
Extracting Language Features
With our clustering model setup to group VAERS data points according to the similarity of values for each of our factors, our team started to consider what to do about the Text variables in the data.
Symptom Description, Other Medication, Allergies, Prior Vaccinations, Current Illnesses and Medical History Notes are all columns containing valuable information that could help to contextualize why a person suffered symptoms. But with these columns recorded in such an unstructured manner, it would be difficult to ask our model to consider their values when clustering the data. Since there are so many different and messy values in these columns, setting them as factors would disrupt the calculation of effective clusters and skew the relationships that were calculated.
Nonetheless, we wanted to analyze these values as part of the study and decided that we needed to find a way of extracting key terms from each of these columns - despite having built our project with the visual editor using a Models → Cluster flow. Not examining these values could result in our team leaving key findings undiscovered or missing obvious relationships in the data.
In order to process text in our clustering flow, we needed to make use of some additional steps that Graphext uses to analyze text. Although Graphext will automatically parse text variables presenting key terms in a filterable list - we wanted to find the significant terms - or ngrams - for all text columns as well as extracting nouns and adjectives from the Symptom Description column.
We opened up the code editor and added the following steps to the top of our project script in order to extract features from the text in these columns.
On this page
- Working with VAERS Data
- Who are VAERS
- Adverse Events in Context
- The Data Collection Process
- A Sample of VAERS data | 2021 Wave
- Accessing the Data
- Limitations of VAERS data
- An Important Disclaimer on Mortality and Recovery Rates
- Preparing the Project
- Joining the Data
- Cleaning the Dataset
- Variable Types
- Setting Intentions
- Building the Project
- Clustering
- Targets and Factors
- Extracting Language Features