DocsPricing

What's new in Graphext?

Page 1Next
January 7, 2025

🌟 New Features

  • Integrations Navigation and Query Preview: Connecting to your data source just got smarter! Graphext now validates your connection before proceeding, reducing errors and saving you time. Once connected, explore your data warehouse with a navigation panel on the left-hand side. Click on tables to preview their structure, including variable names and data samples. You can even preview query outputs, such as joins, before creating your Graphext project. Watch the video example to see this streamlined workflow in action!
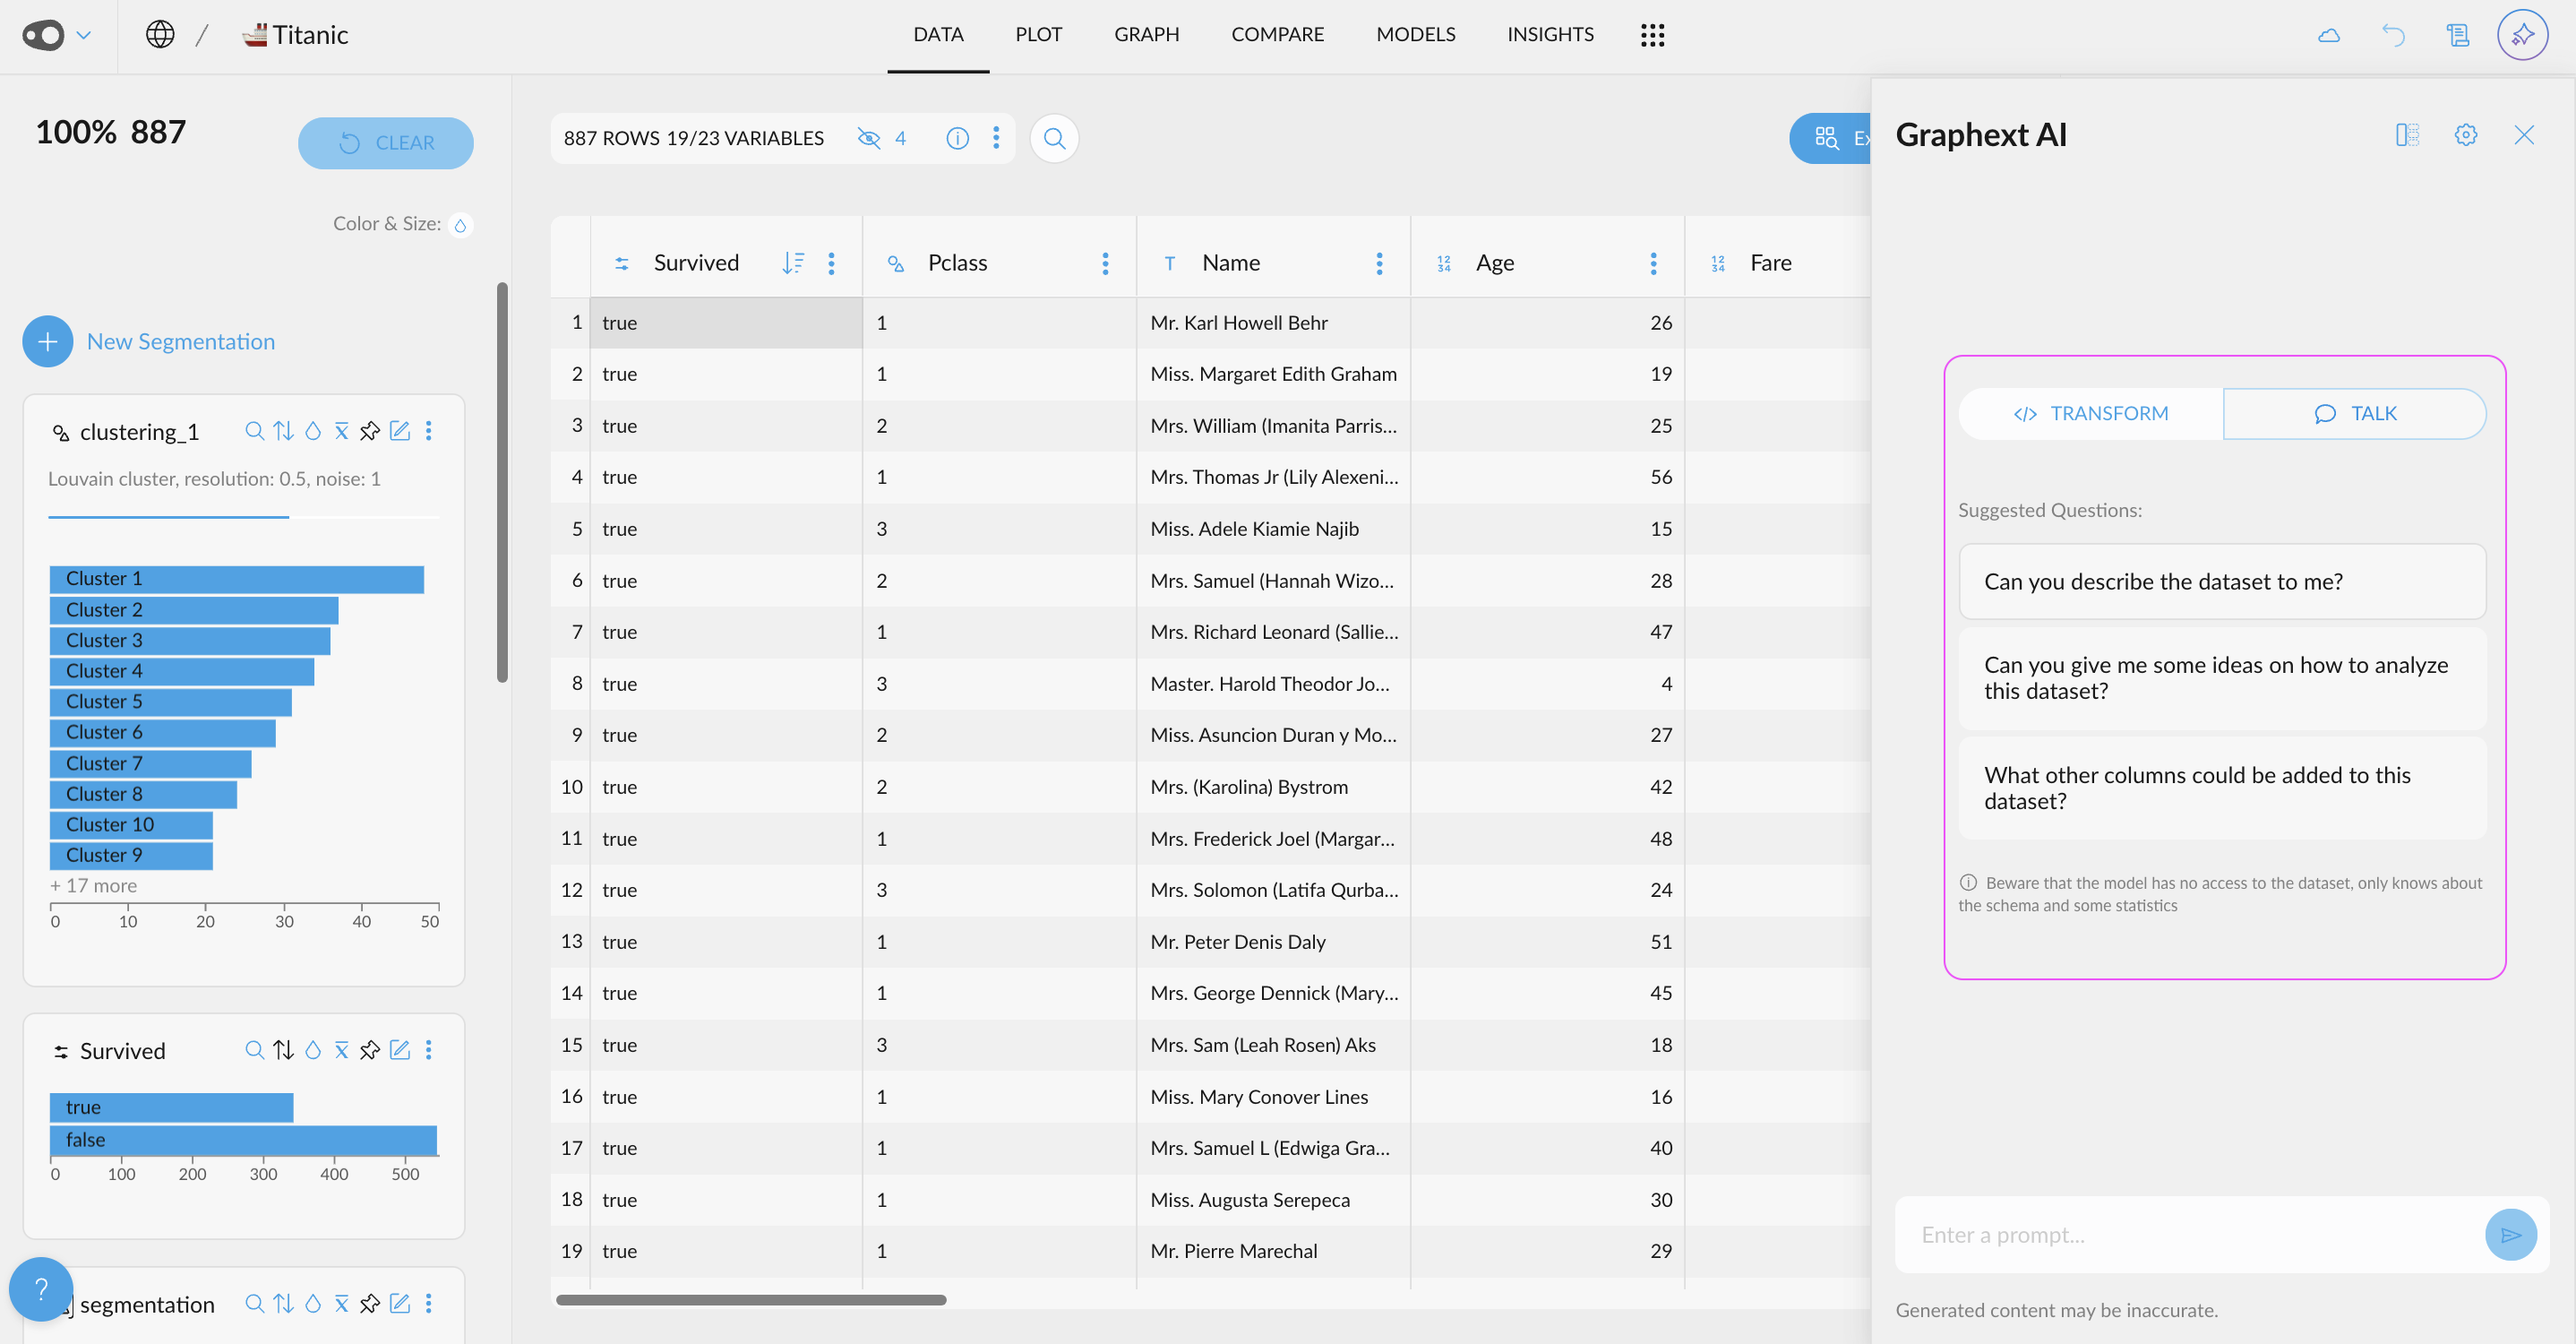
  • Chat Freely with the AI About Your Data: Introducing a toggle to switch modes in the AI Chat! Seamlessly switch between Chat Freely mode for open-ended questions and Transformations mode to focus on specific data operations.
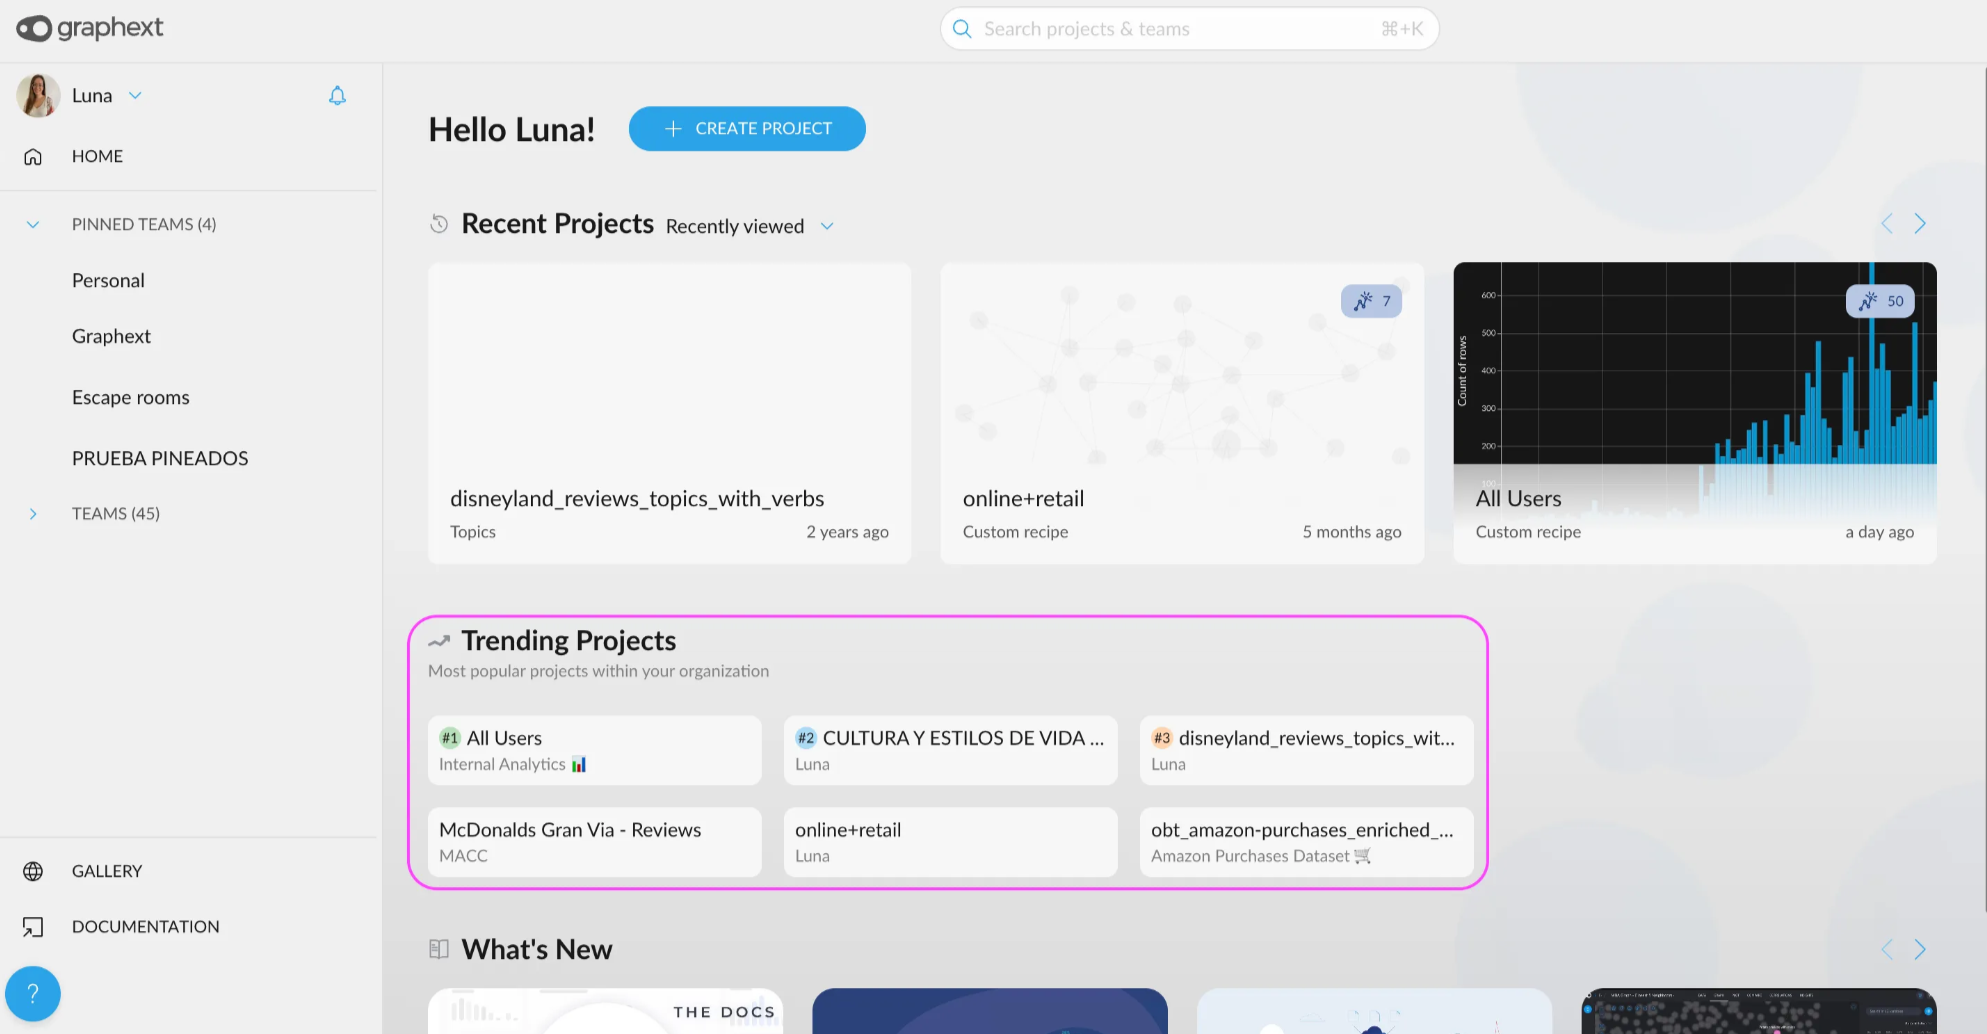
  • Discover Trending Projects in the Home Section: Find out what’s buzzing in your team! A new section in the Home view highlights recently visited projects from teams you’re part of. Stay informed about the projects generating the most interest and quickly find the ones your teammates are discussing in daily meetings.
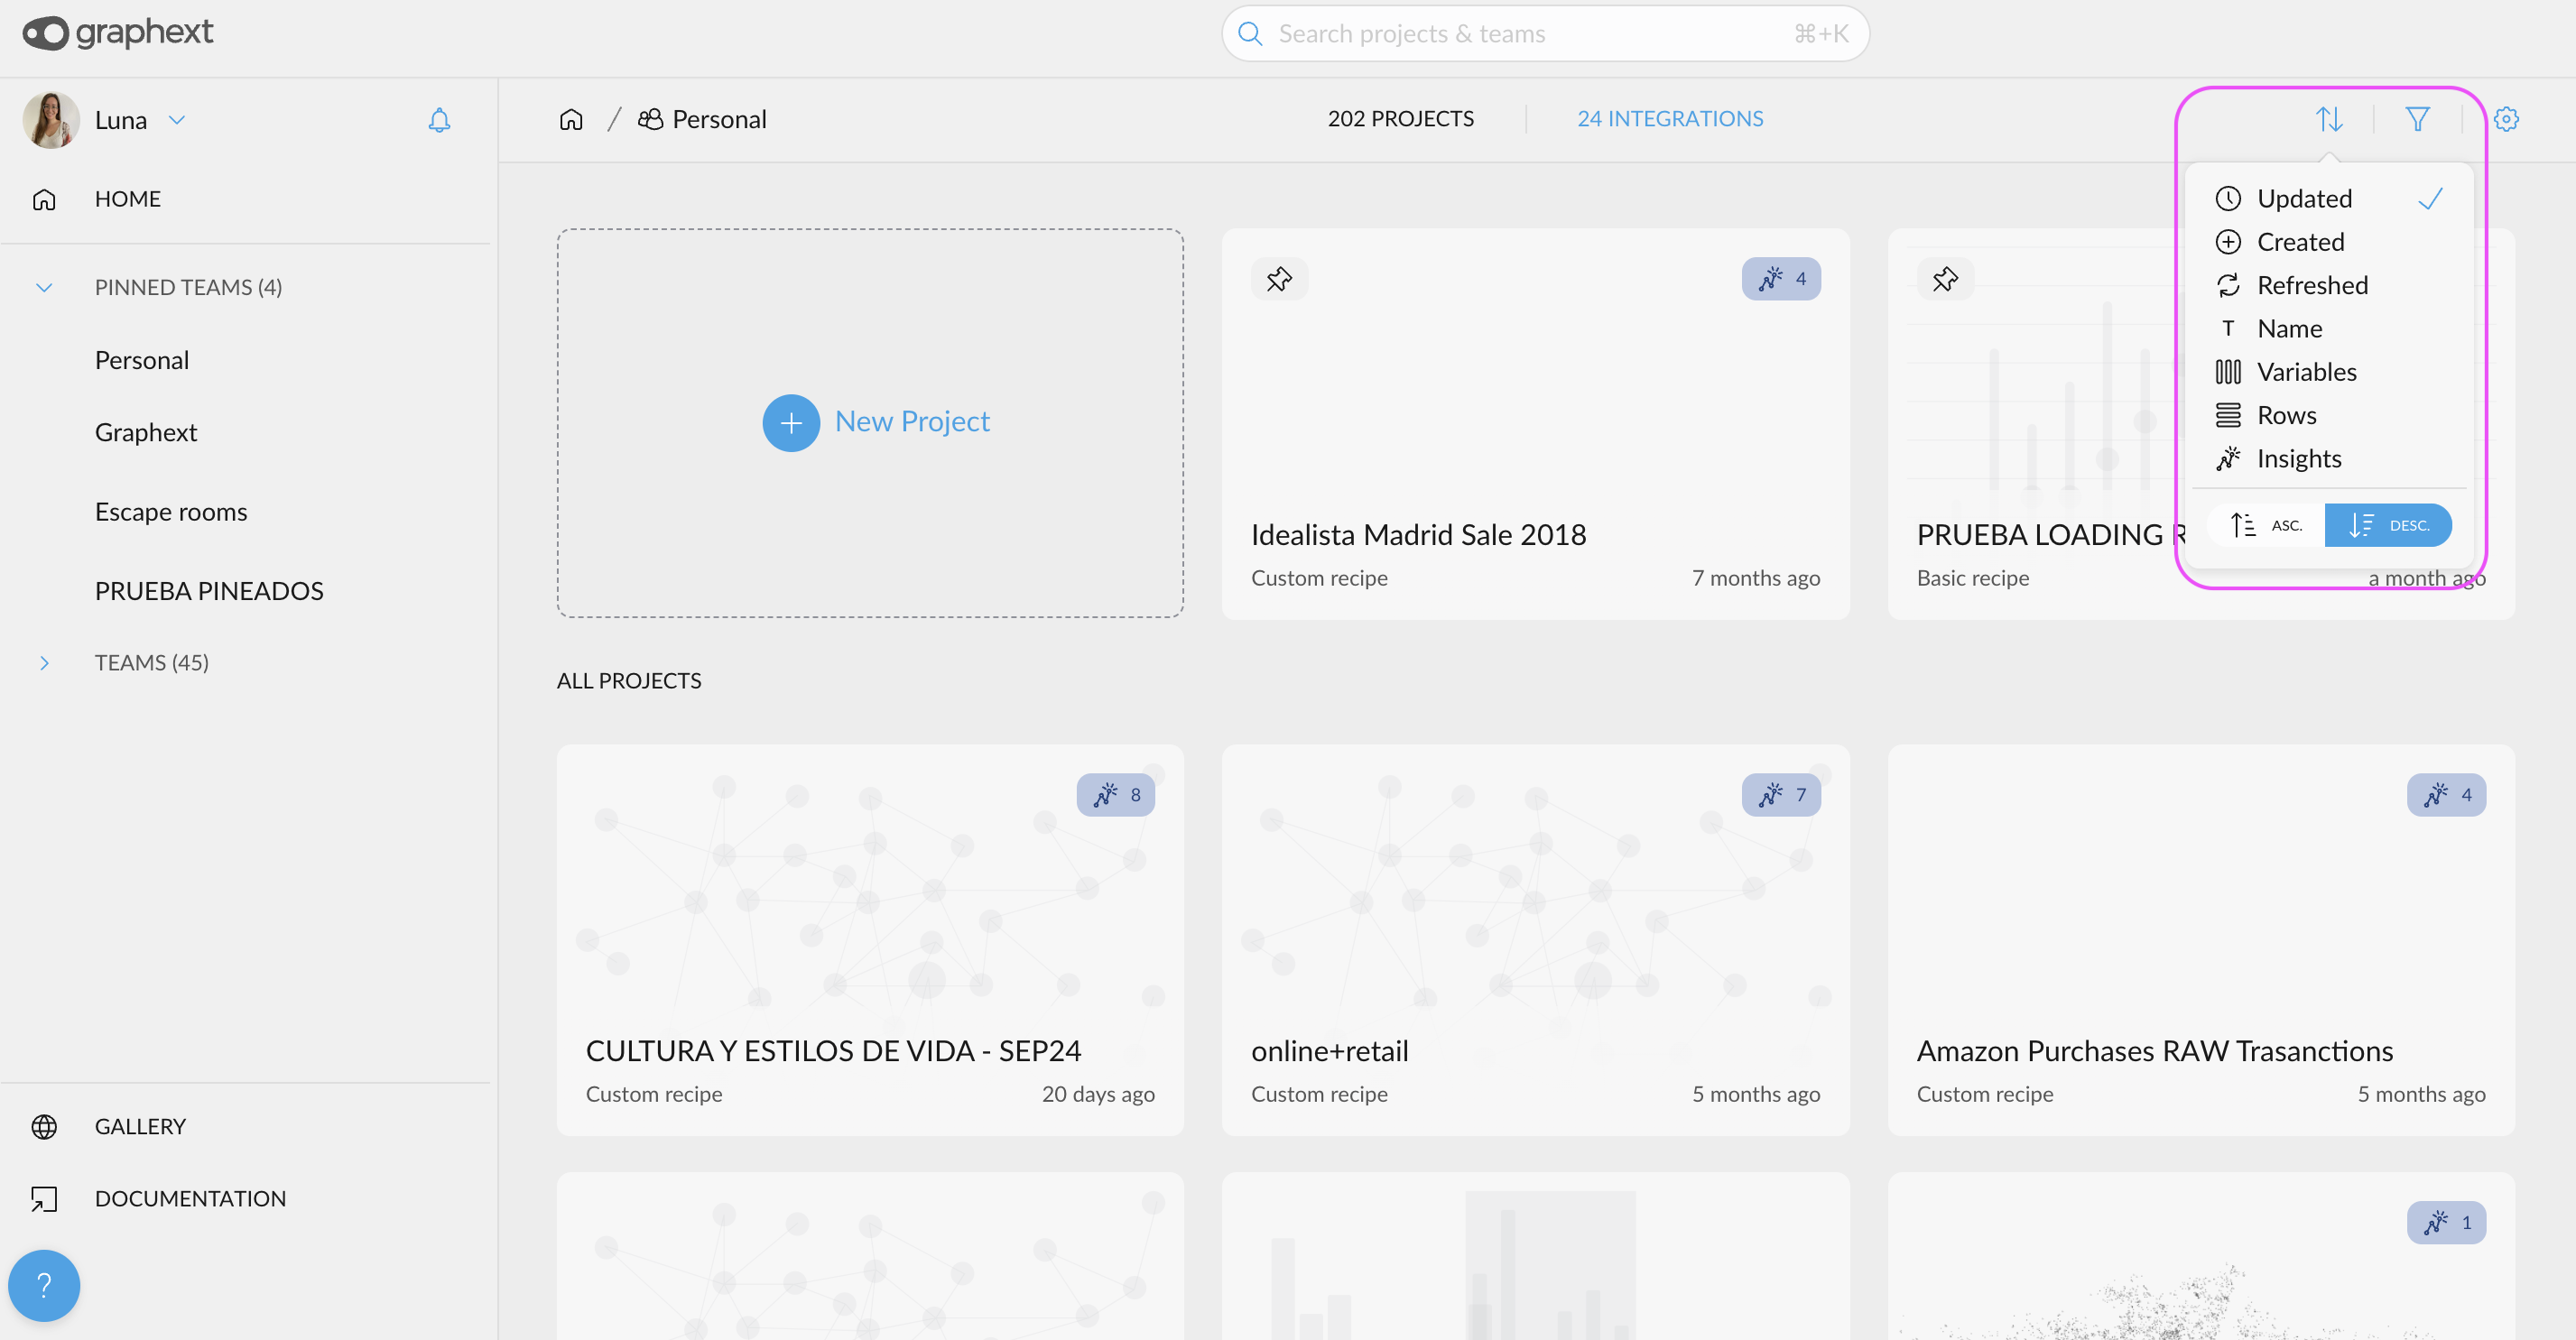
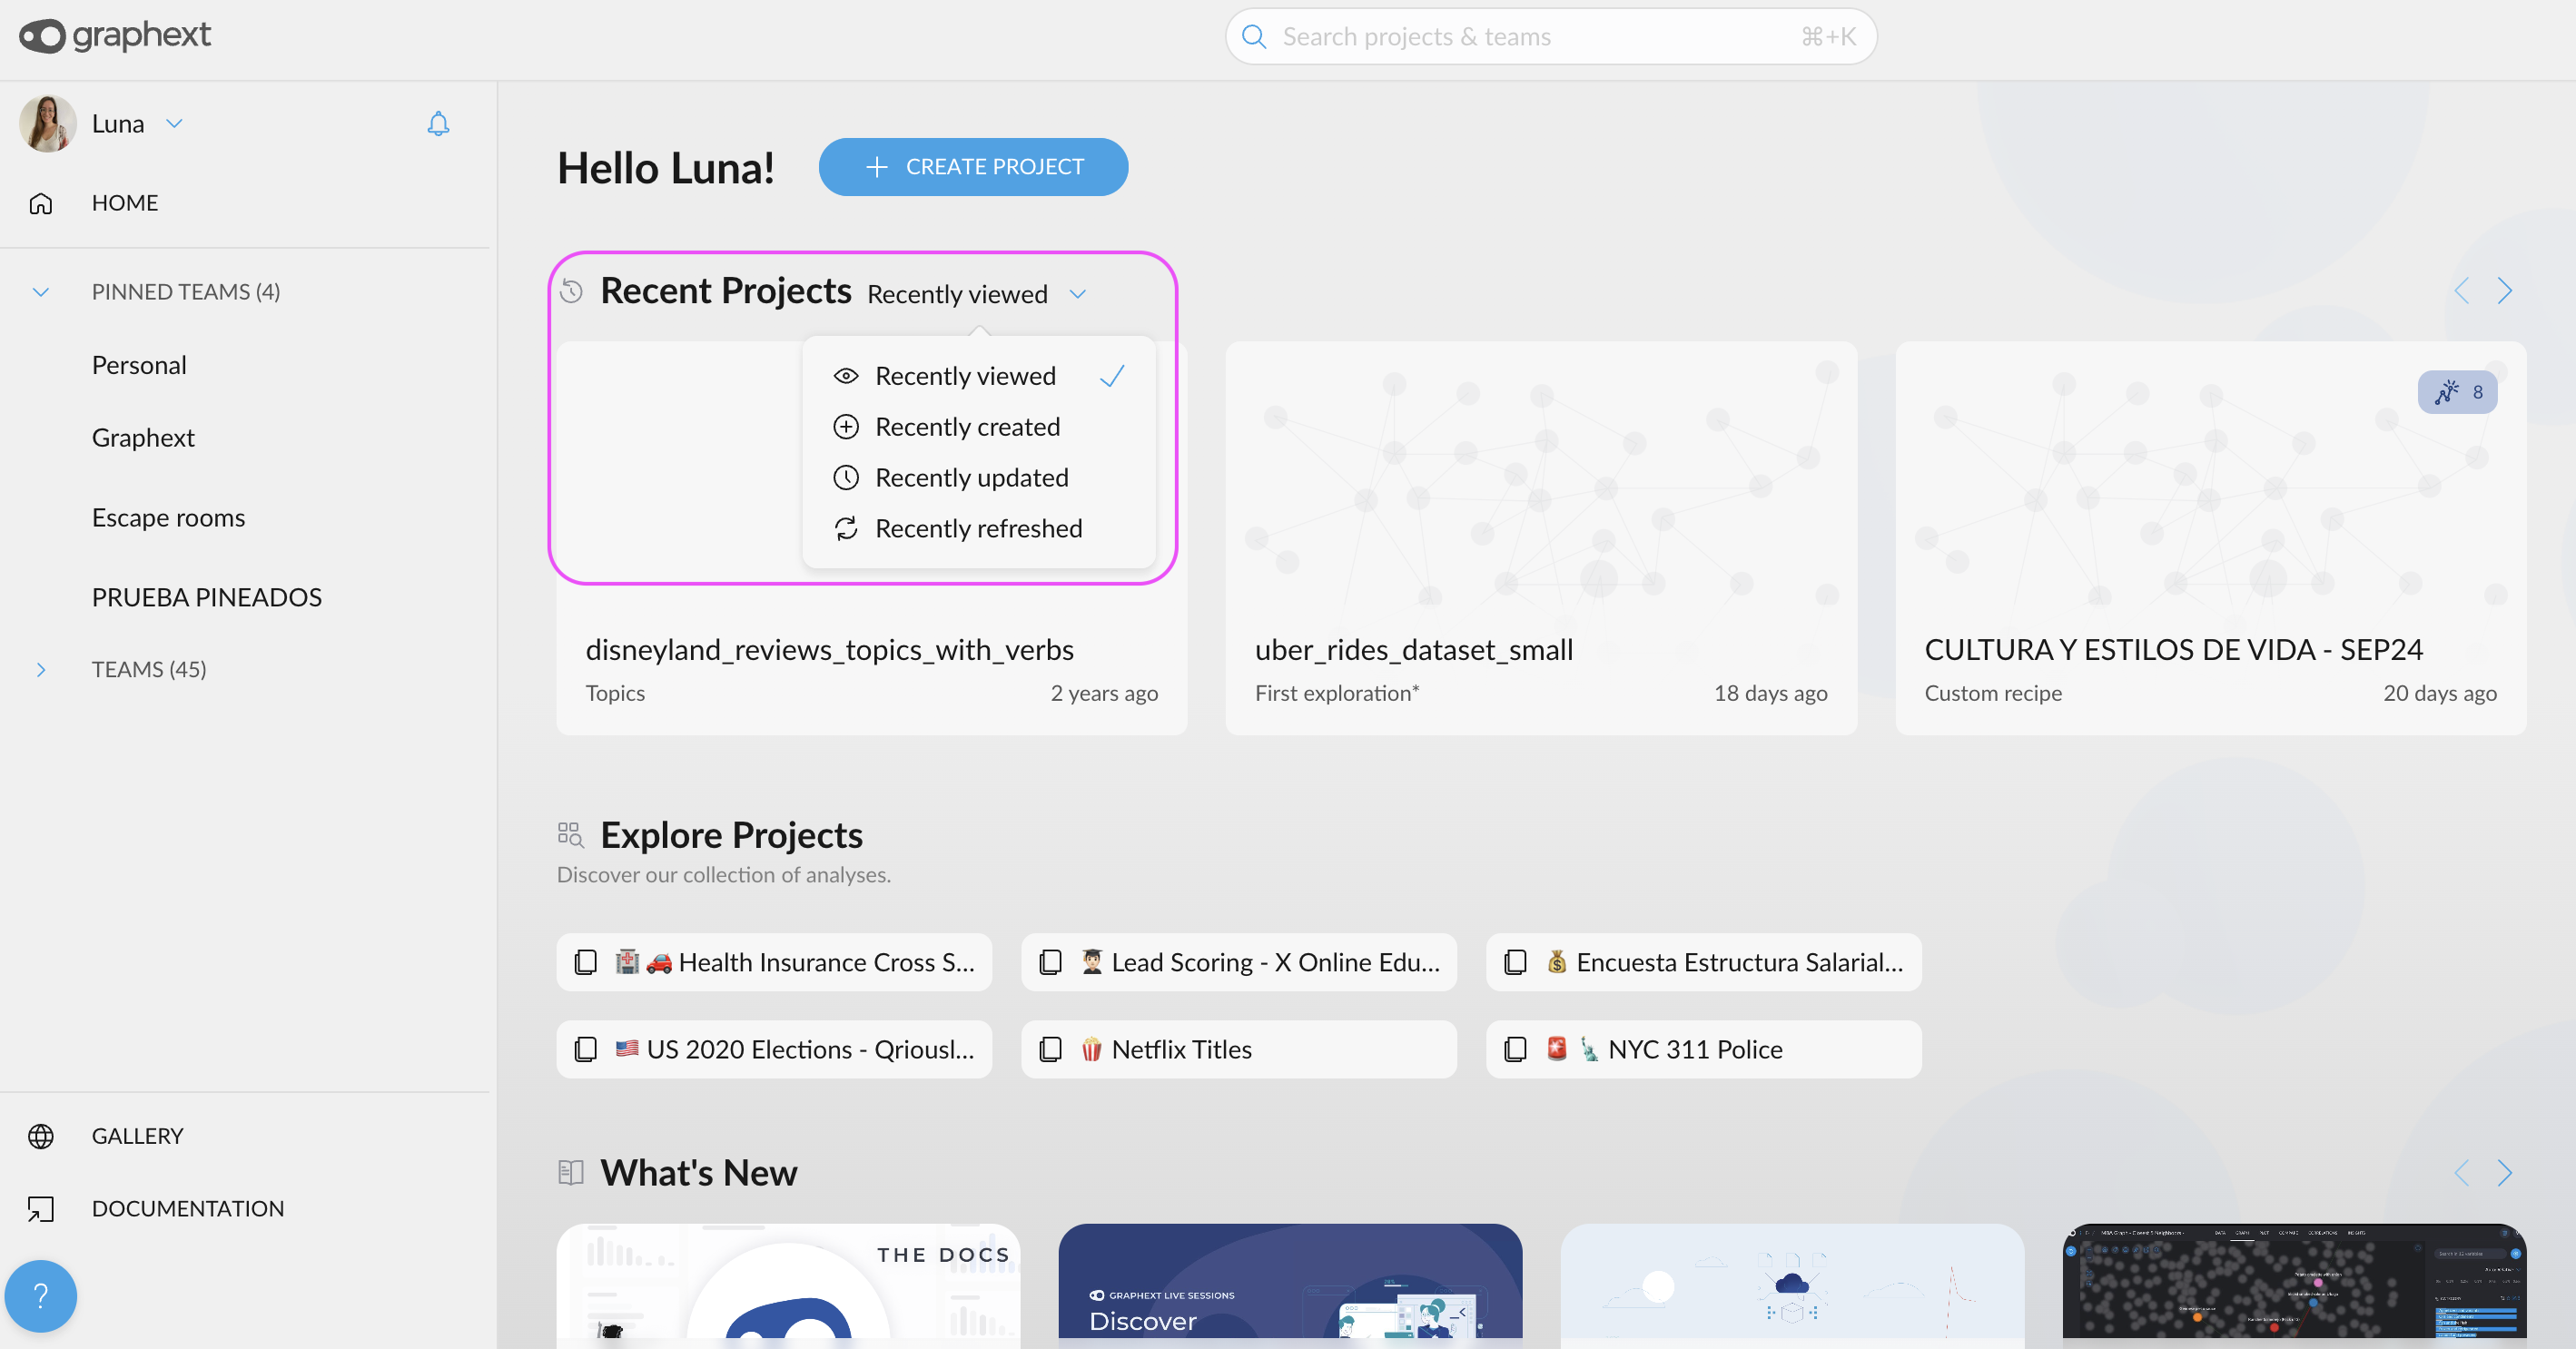
  • New Filter & Sorting Criteria for Projects: Organize your projects with greater flexibility. In both the Home and Team views, you can now sort projects by additional criteria: viewed, created, updated, and refreshed. Find what you need faster than ever!
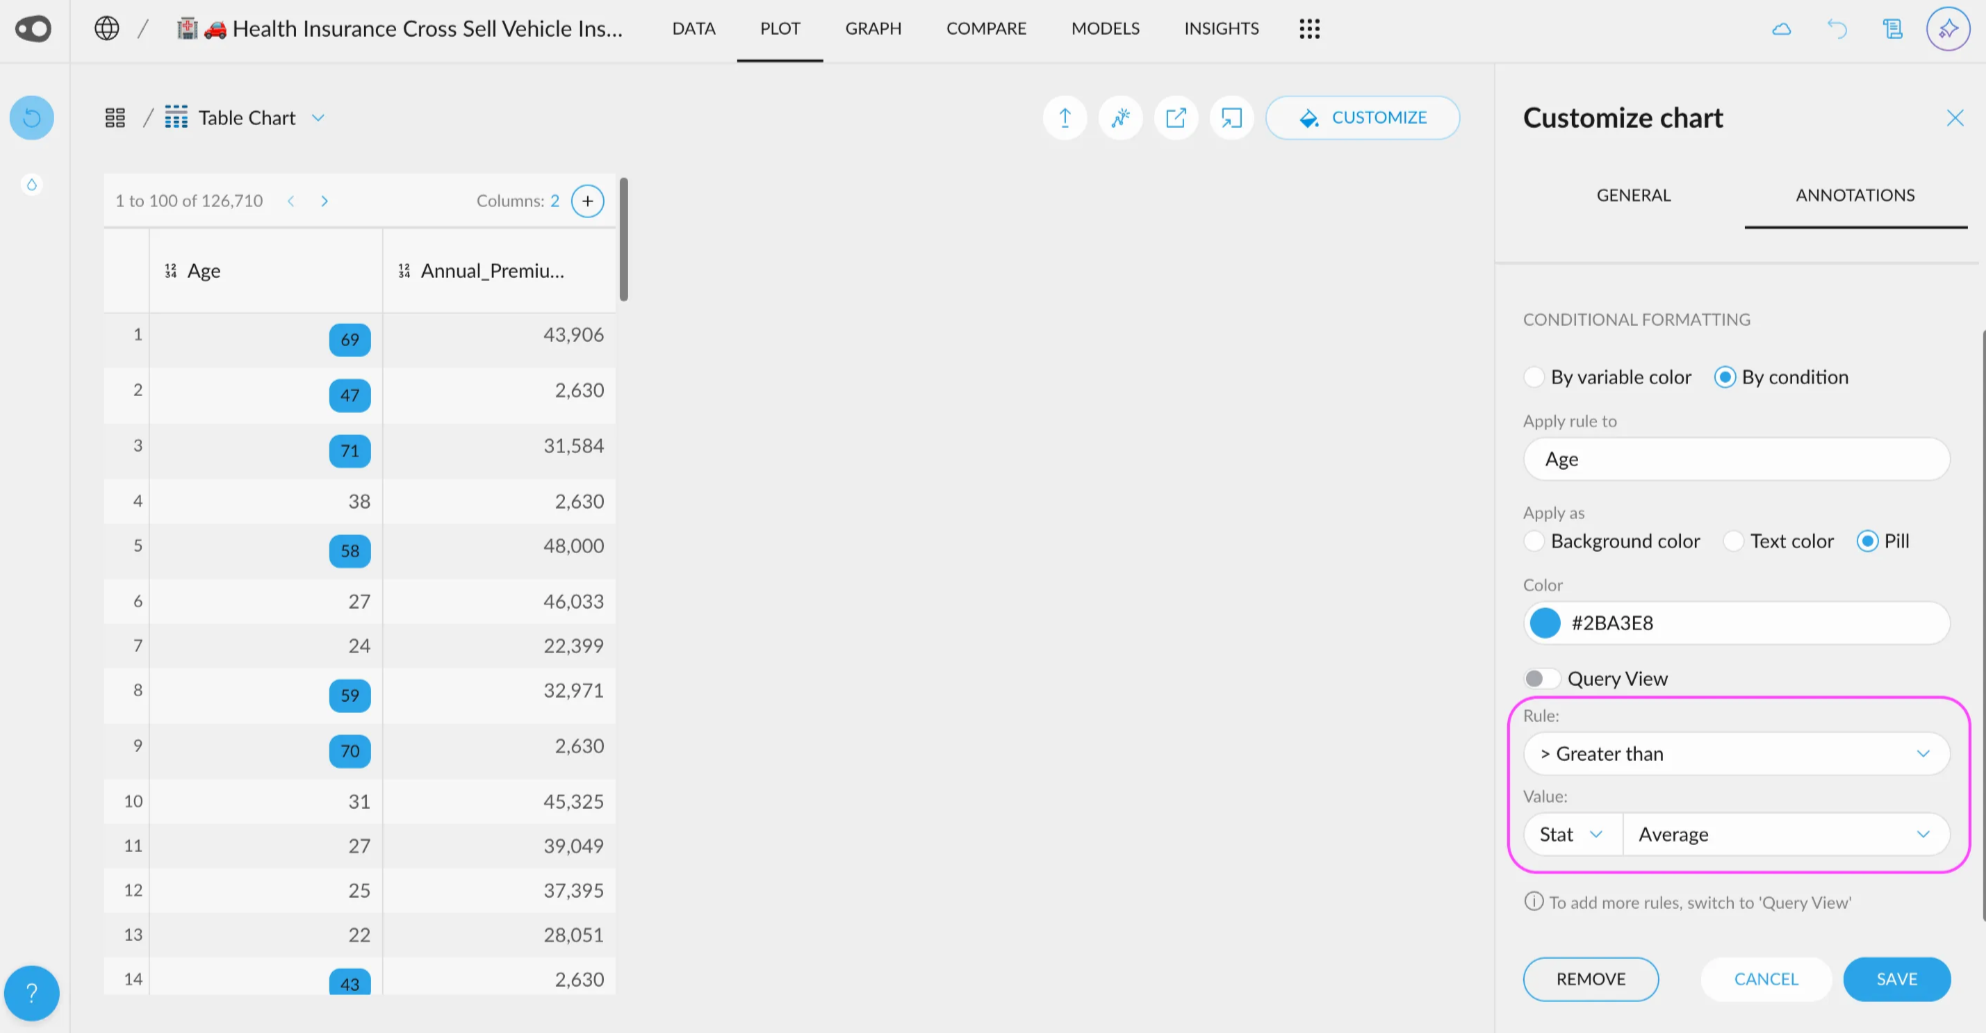
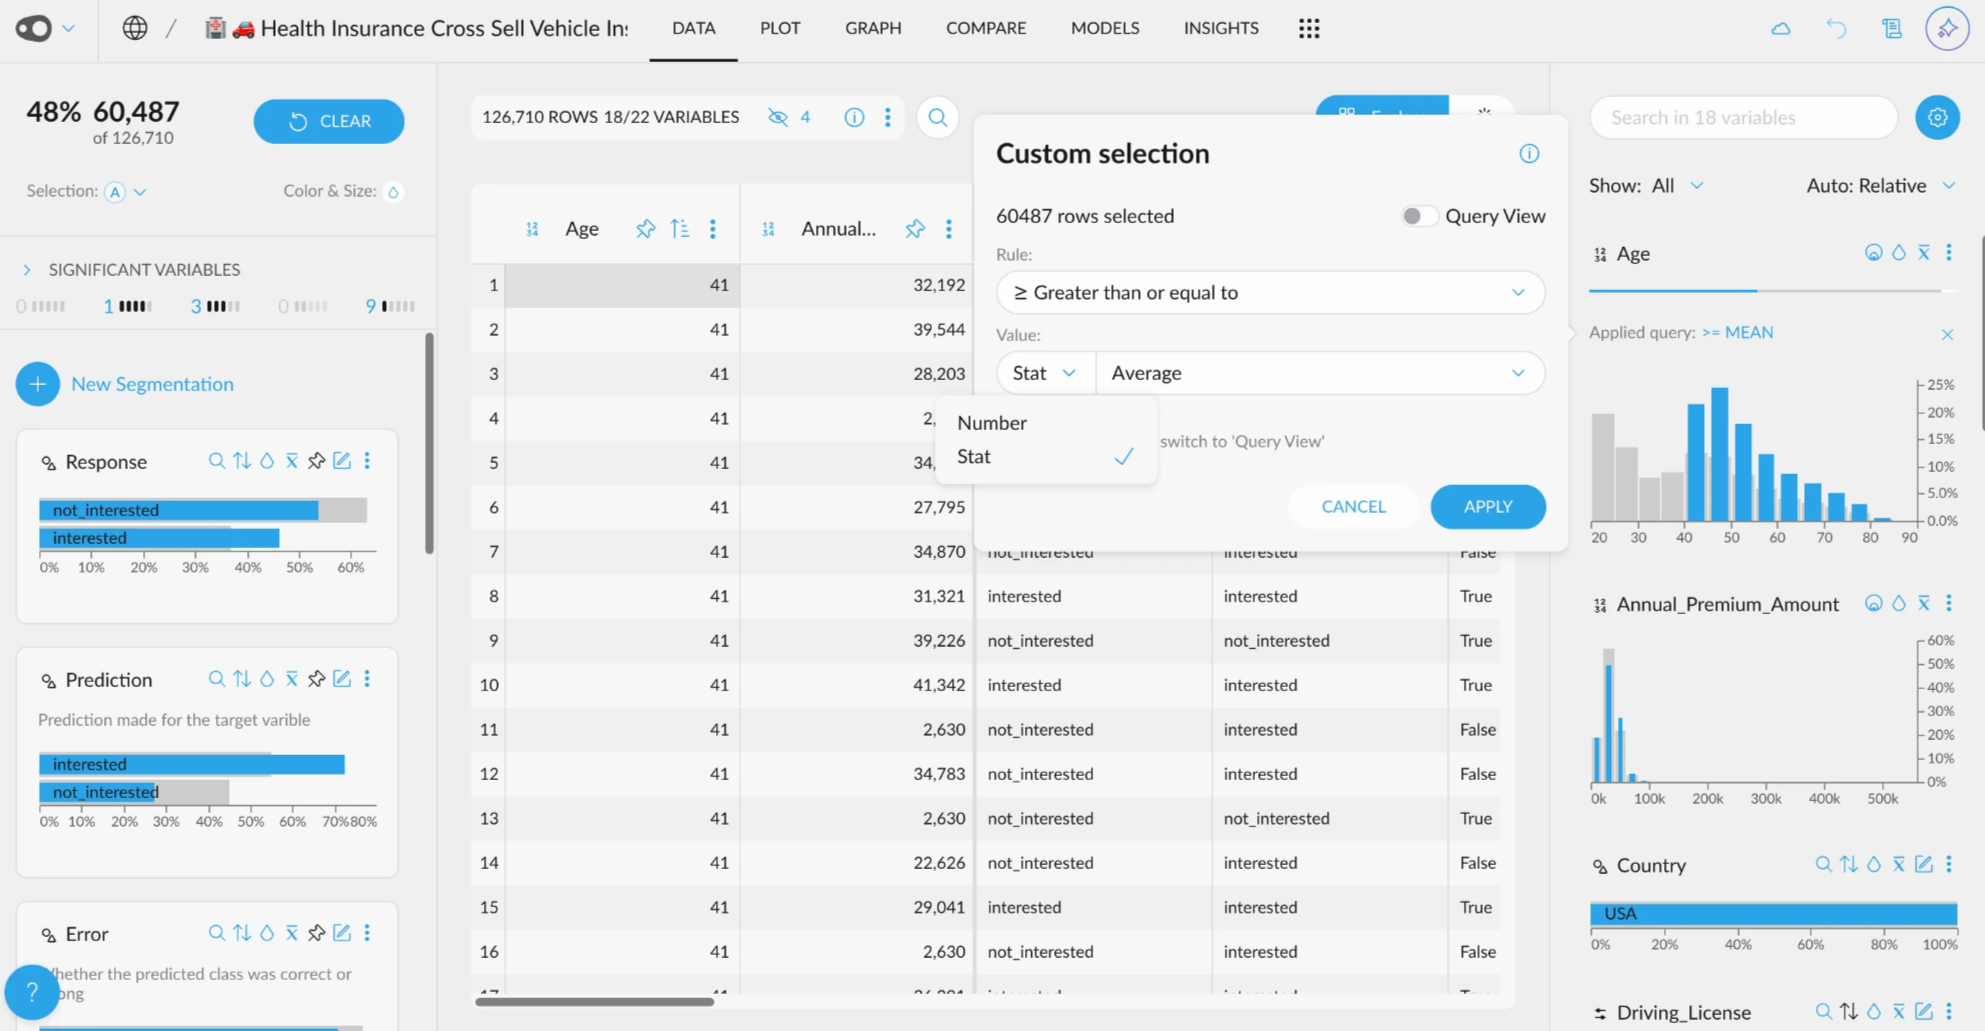
  • New UI for Quantitative Variable Selections: A new user-friendly interface allows you to customize your selections with just a few clicks. You can also use this UI, for the coloring rules in the table in plot
December 24, 2024

🌟 New Features

  • ROC & Precision-Recall Curves in the Models section: When training a predictive model, you’ll now have detailed performance insights. Evaluate your model’s performance with ROC and Precision-Recall curves, giving you a clearer understanding of its strengths and weaknesses.
  • Discretize date columns in the Summary Table: You can now group date columns directly in the Summary Table (Group by)! Discretize by Year, Month, Week, Day, Hour, and more to make analyzing date-based trends easier and more flexible.
  • Format numbers in the Table & Summary Table (Plot): Bring consistency to your data presentations by formatting numbers in tables. Add decimal precision for better comparison or use a compact format like 1.23k for large numbers.
  • ‘Count Where’ and ‘Percent Where’ are now available as an aggregation option in the Summary Table: Unlock new aggregation possibilities with the Count Where and Percent Where options. For example, calculate the percentage of users in a segment (e.g., Age 18–30, Male, from Barcelona) who voted for a specific political party.
  • Now you can manually adjust the width of the table columns: Say goodbye to truncated headers! You can now manually adjust table column widths, making it much easier to handle long column names and optimize table readability.
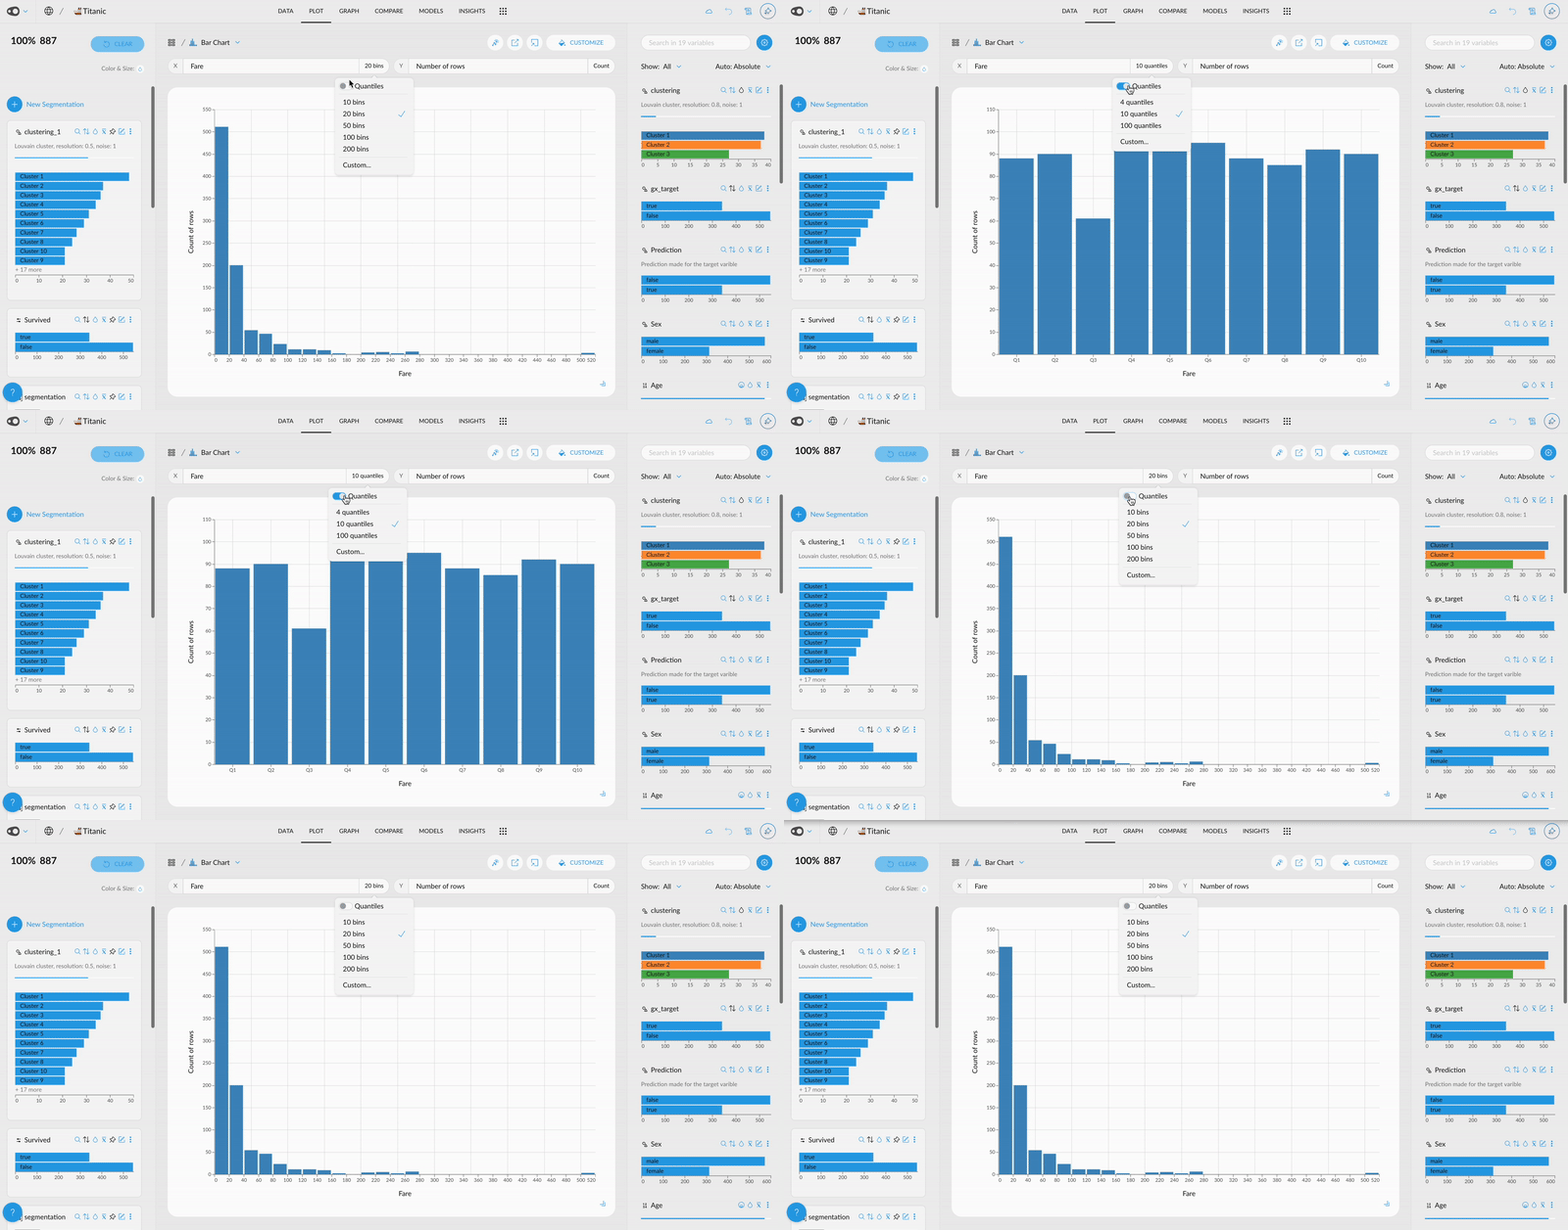
  • Group by and Create Bins by Quantiles: Introducing dynamic quantile creation for variables in plots and tables! This is especially helpful for skewed data distributions. For instance, when your model's predicted probabilities are mostly low with a few high values, you can now group them into quantiles for clearer analysis. Quantiles are also available in the Group By table, adding even more flexibility to your data exploration.

🎨 UI Updates

  • Models Tab Redesign: We’ve given the Models tab a fresh new look! Components have been reorganized for a cleaner and more intuitive layout, with an emphasis on the most relevant metrics. Explore your models with improved clarity and focus.

🔧 Technical Updates

  • The group_by step, supports ‘Count Where’ and ‘Percent Where’
December 10, 2024

🌟 New Features

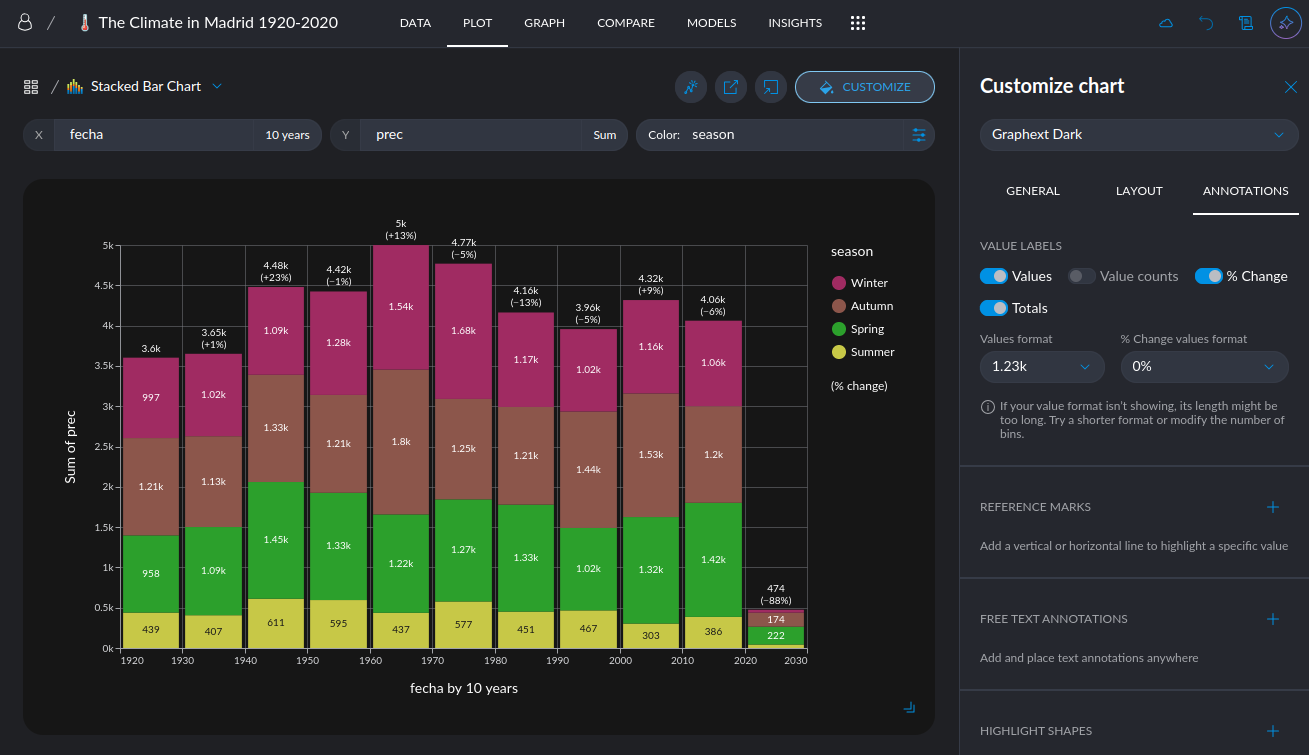
  • Percentage Change Labels for Bar and Line Charts:

Easily track trends with percentage change labels! You can now display the percentage change between consecutive bins in simple or stacked bar charts, as well as in line charts. This addition provides a clear, visual way to highlight growth, decline, or fluctuations over time, making your data storytelling more impactful and intuitive.

https://x.com/victorianoi/status/1862068925015408892
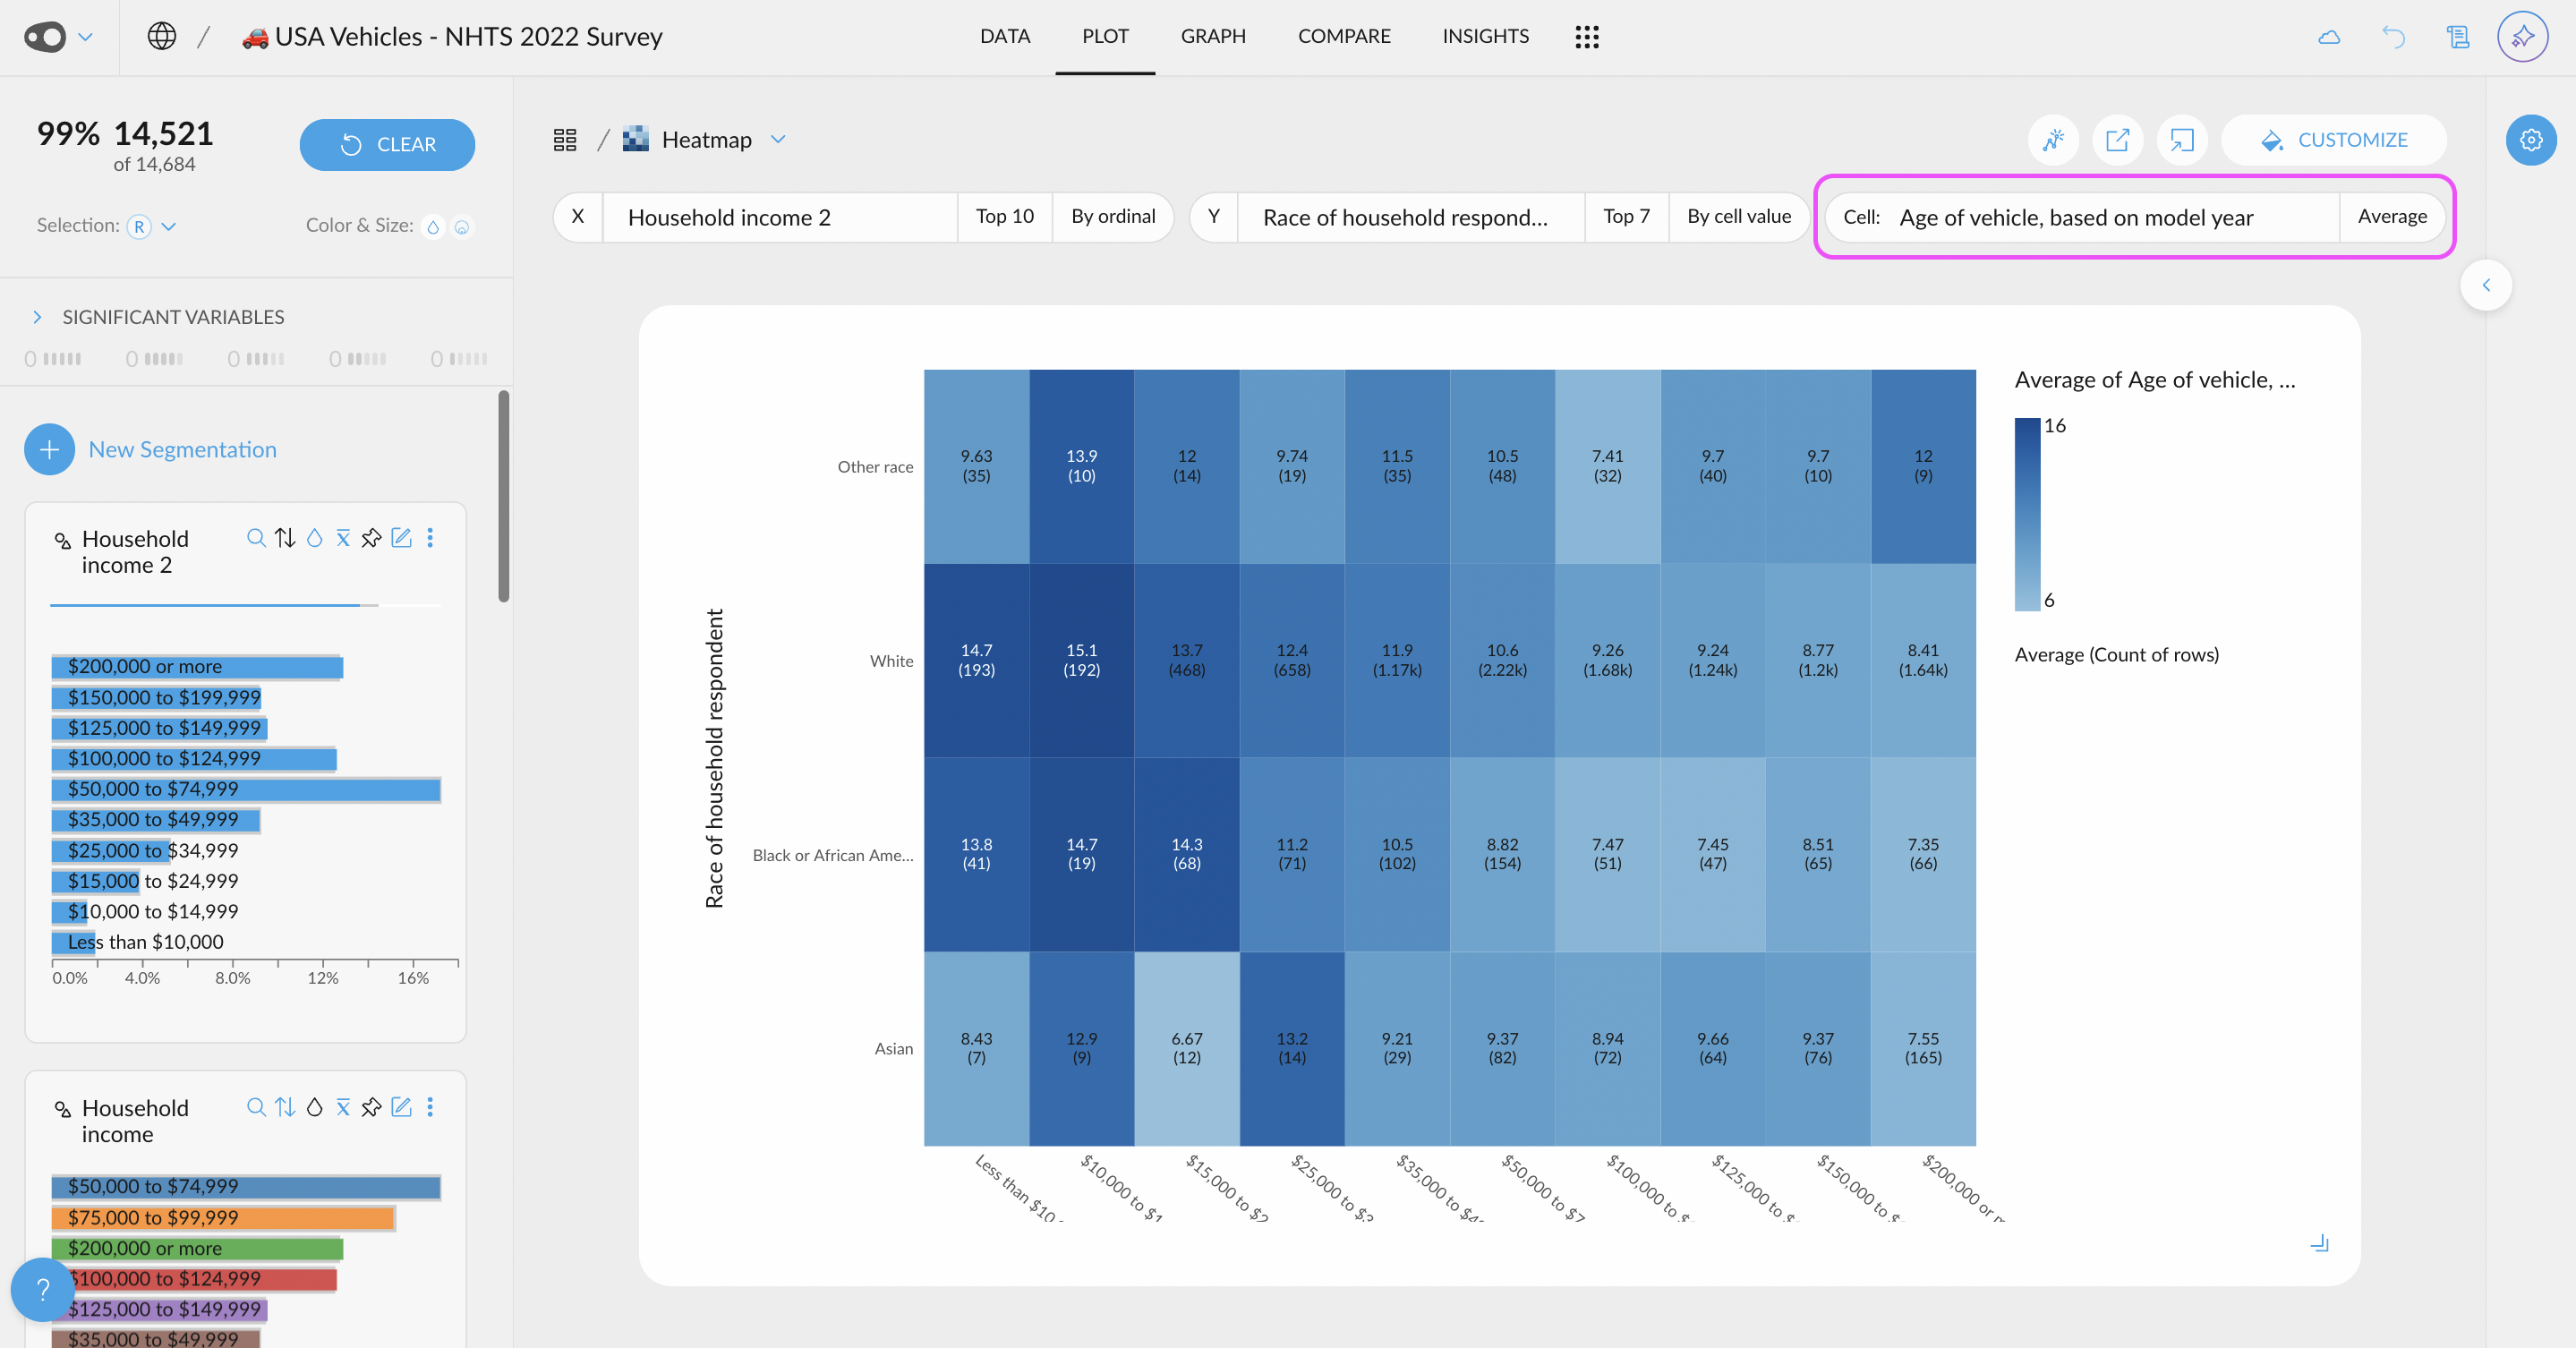
  • Map numerical variables to the cells in the Heatmap: Enable mapping of numerical variables to heatmap cell values. Previously limited to count or relative count, users can now display metrics such as total revenue, average age, or any other numerical aggregation.

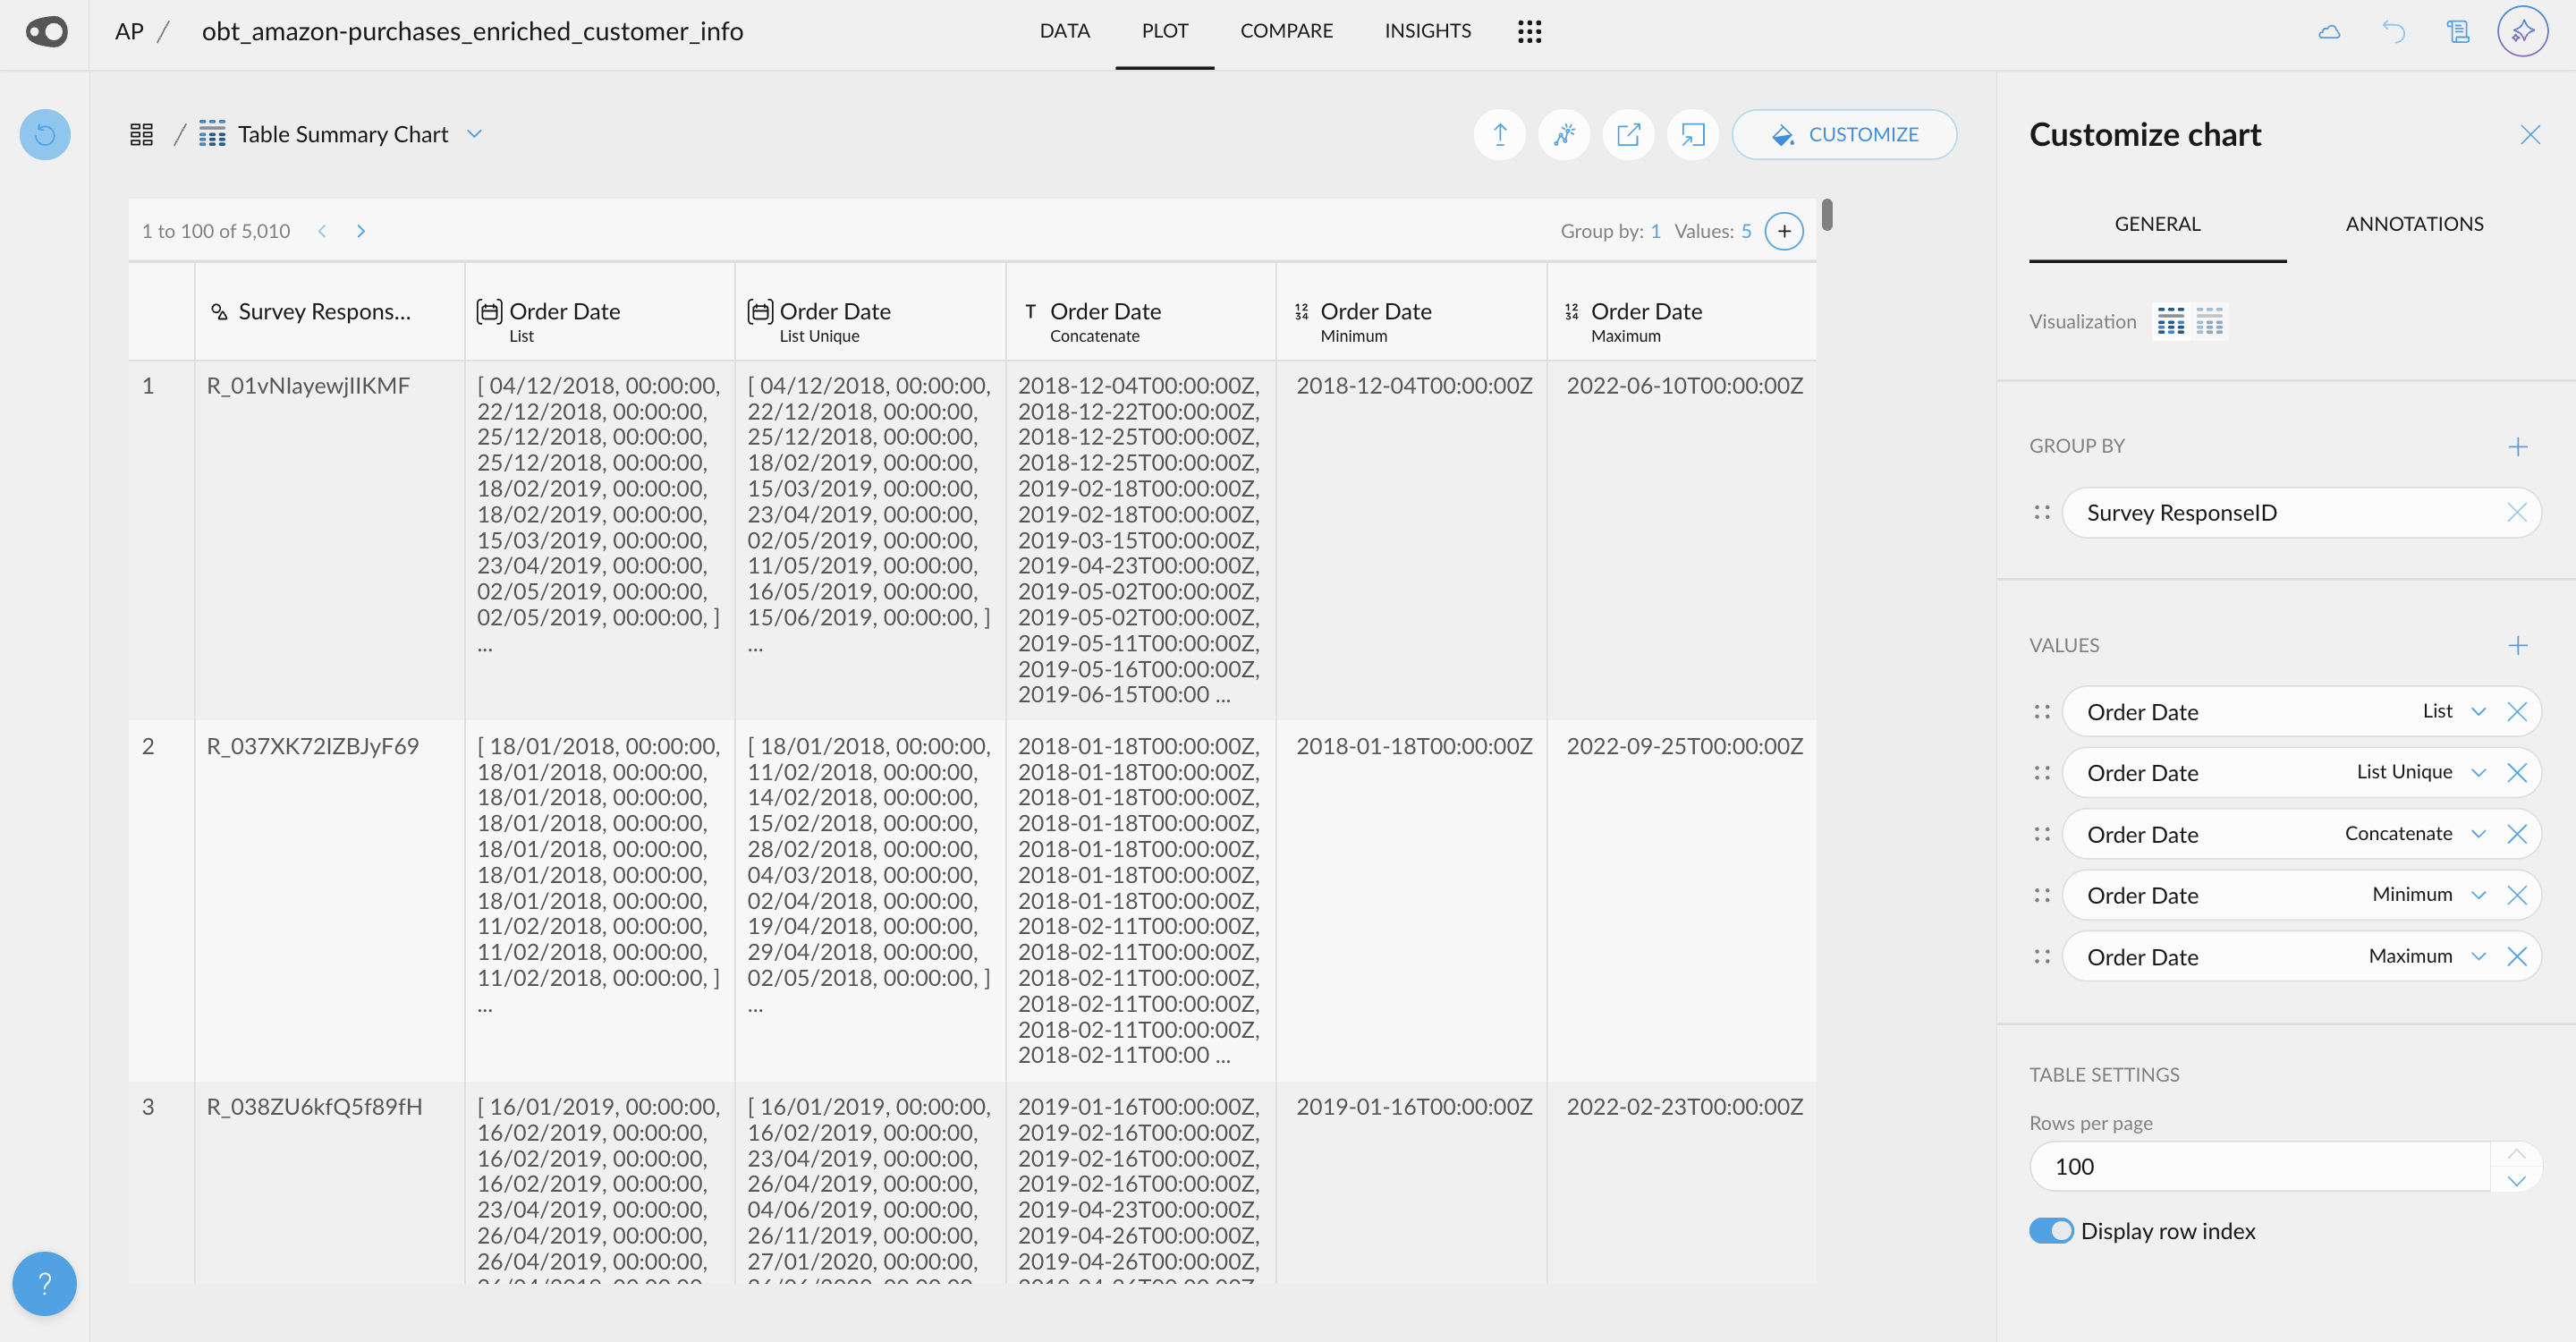
  • New aggregations in the Summary Table: Use list, list unique & concatenate aggregations for quantitative & date columns in Summary Table. Also Unlock new aggregation possibilities by grouping date variables into lists! This feature is perfect for cases where you need to group by a customer ID and retain all the unique transaction dates, or when you want to capture individual purchase dates—even if multiple purchases occurred on the same day. Combine this with segment or gradient-based coloring for tables to make your visualizations even more insightful and impactful.
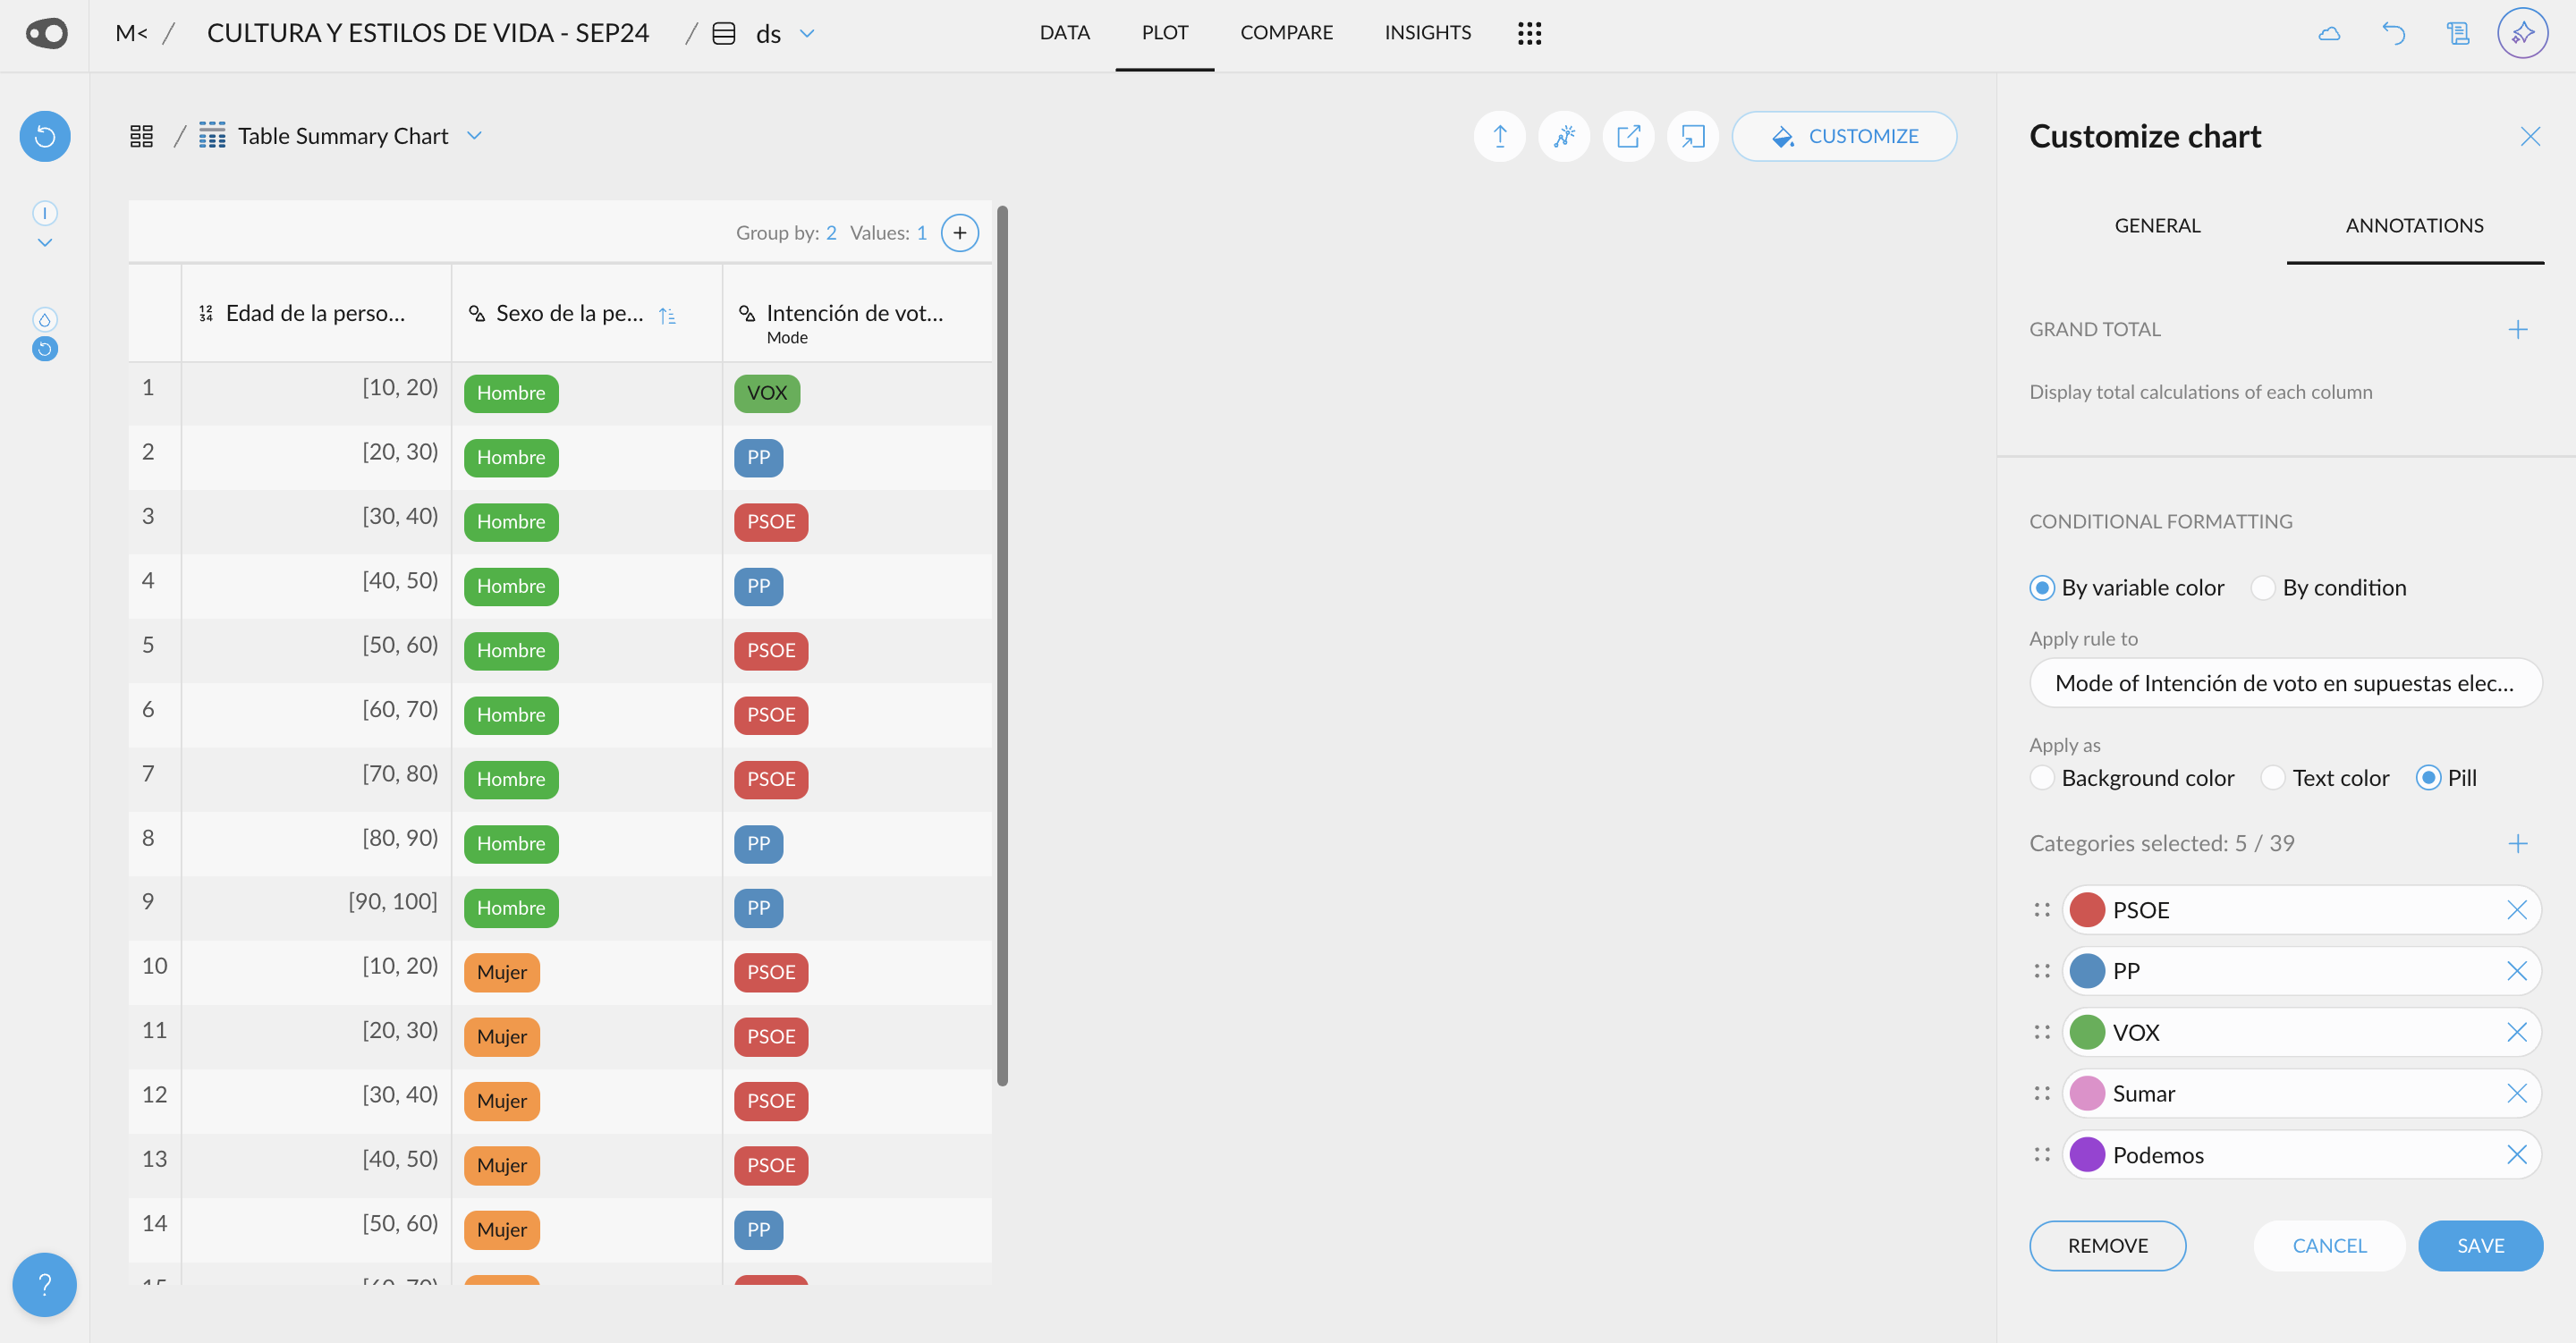
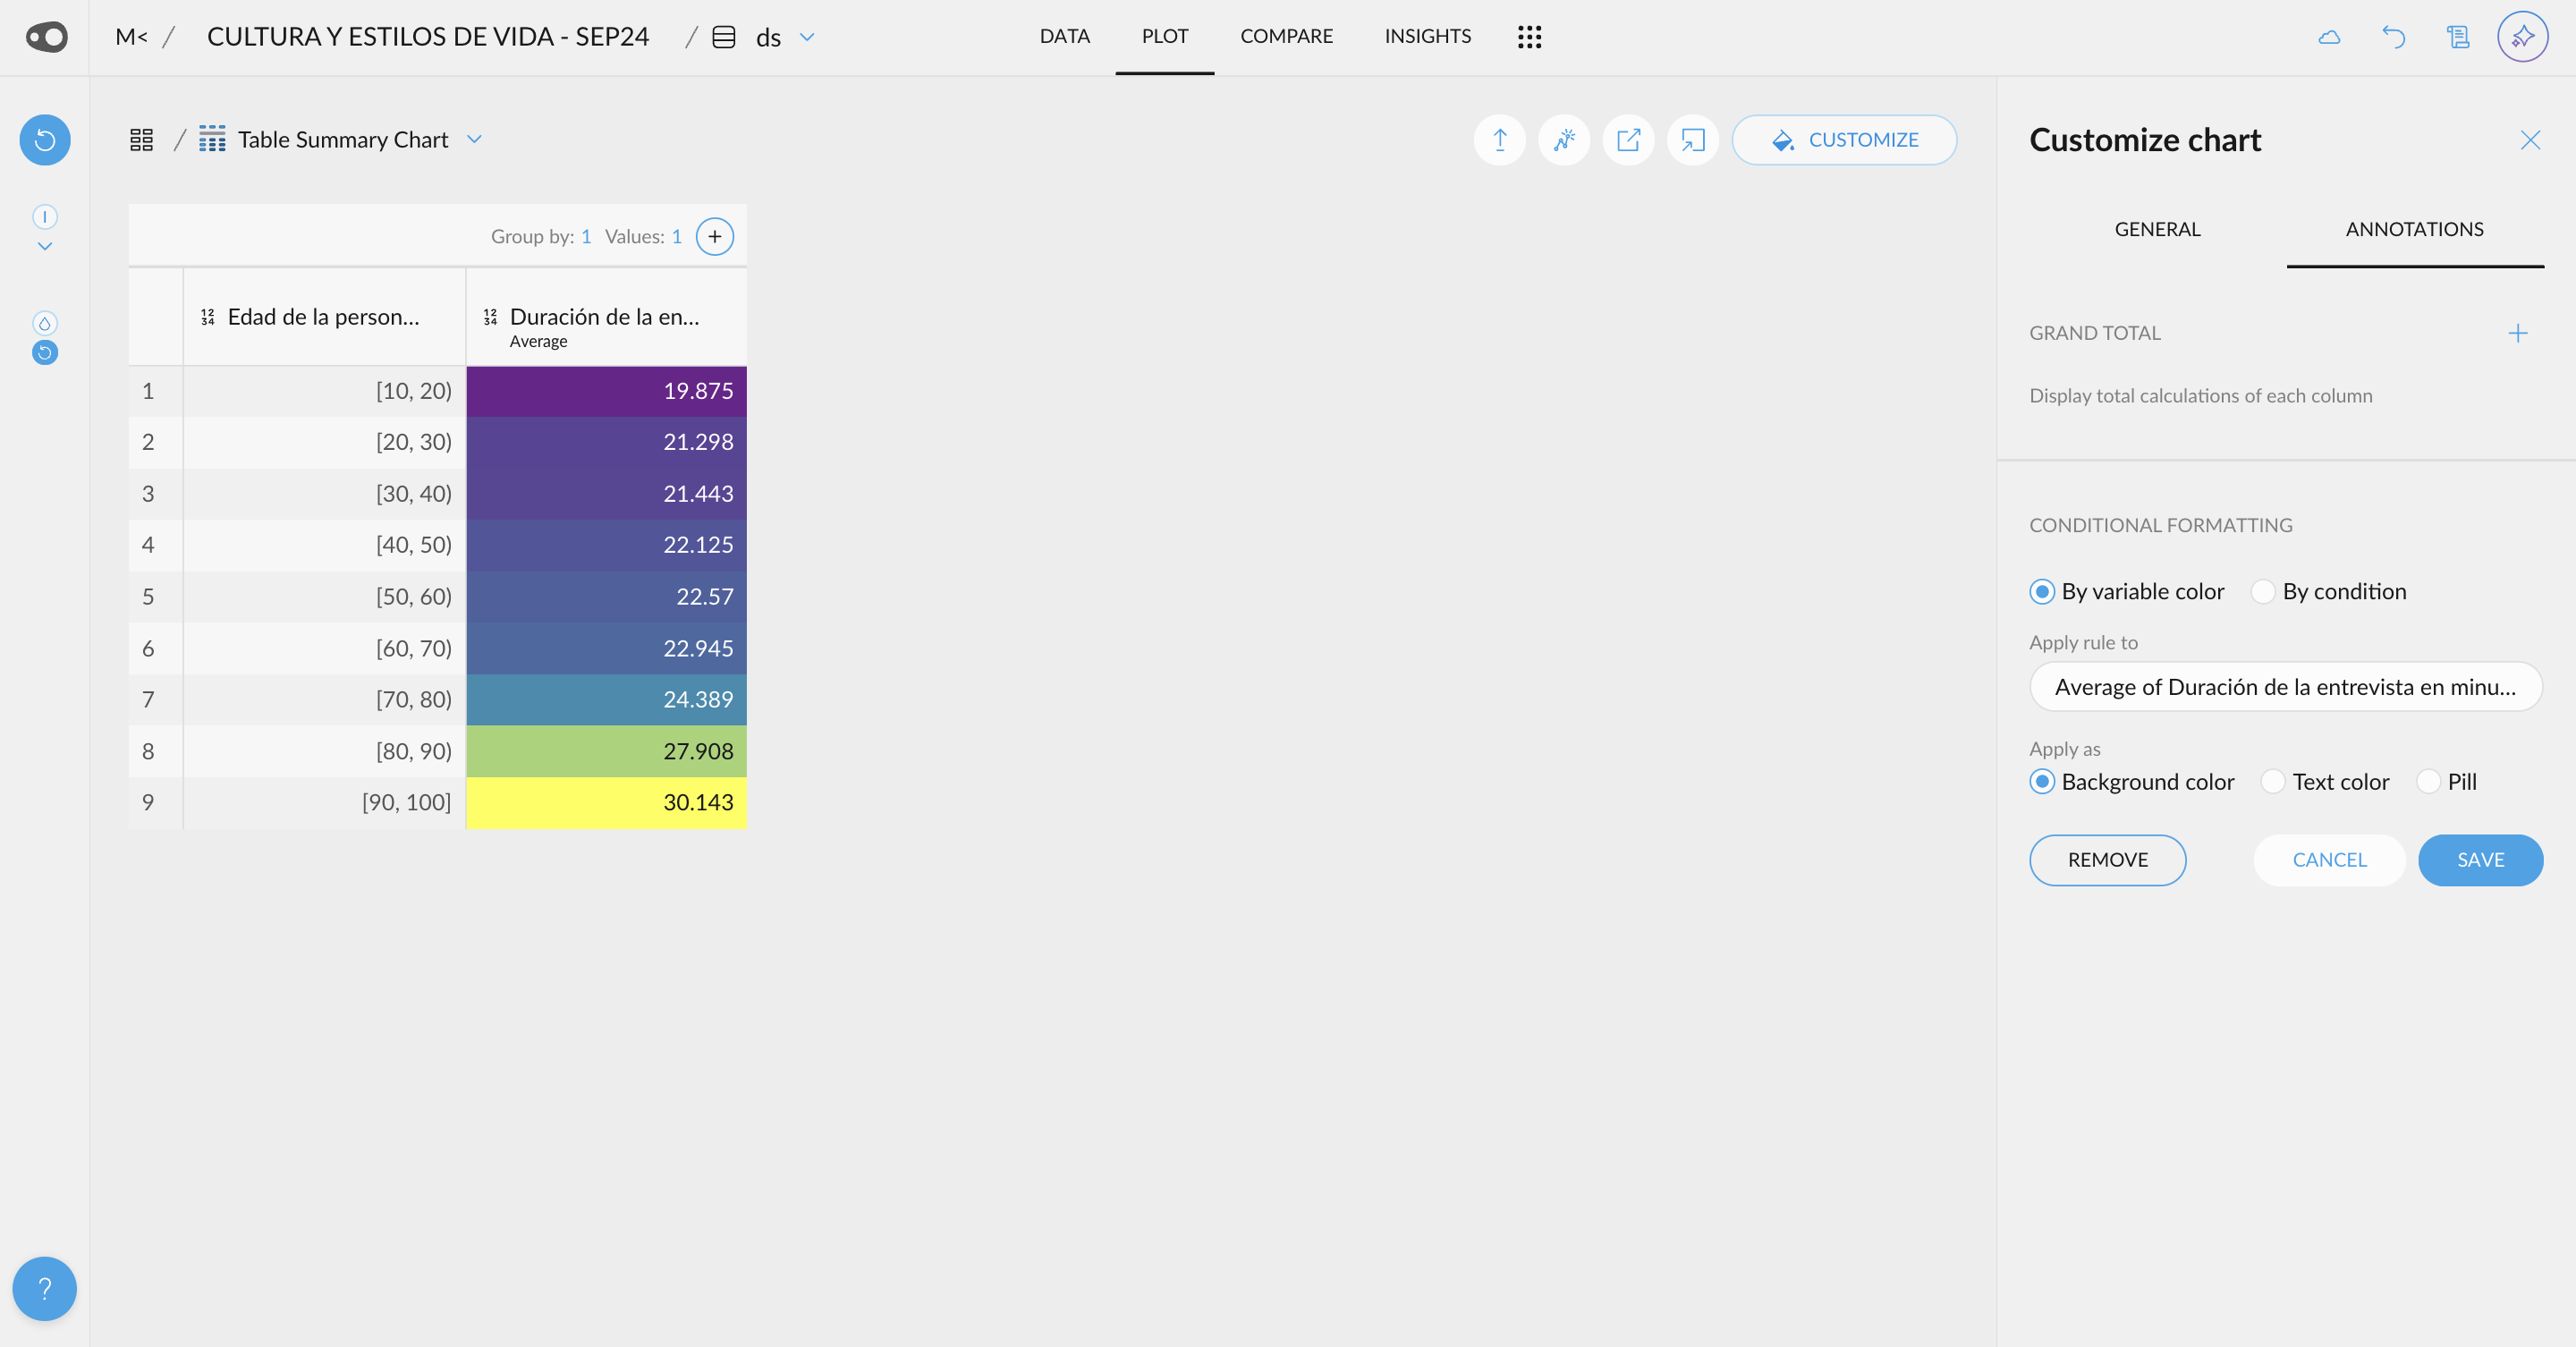
  • Color Tables by Segment or Numerical Gradients:

You can now apply segment-specific colors directly to table rows or cells, making it easier to align visuals with existing segment definitions—such as brands, political parties, or any other categories—boosting communication clarity and impact. Additionally, numerical variables can now be colored with gradient scales, providing a powerful way to highlight patterns and trends at a glance.

November 26, 2024

🌟 New Features

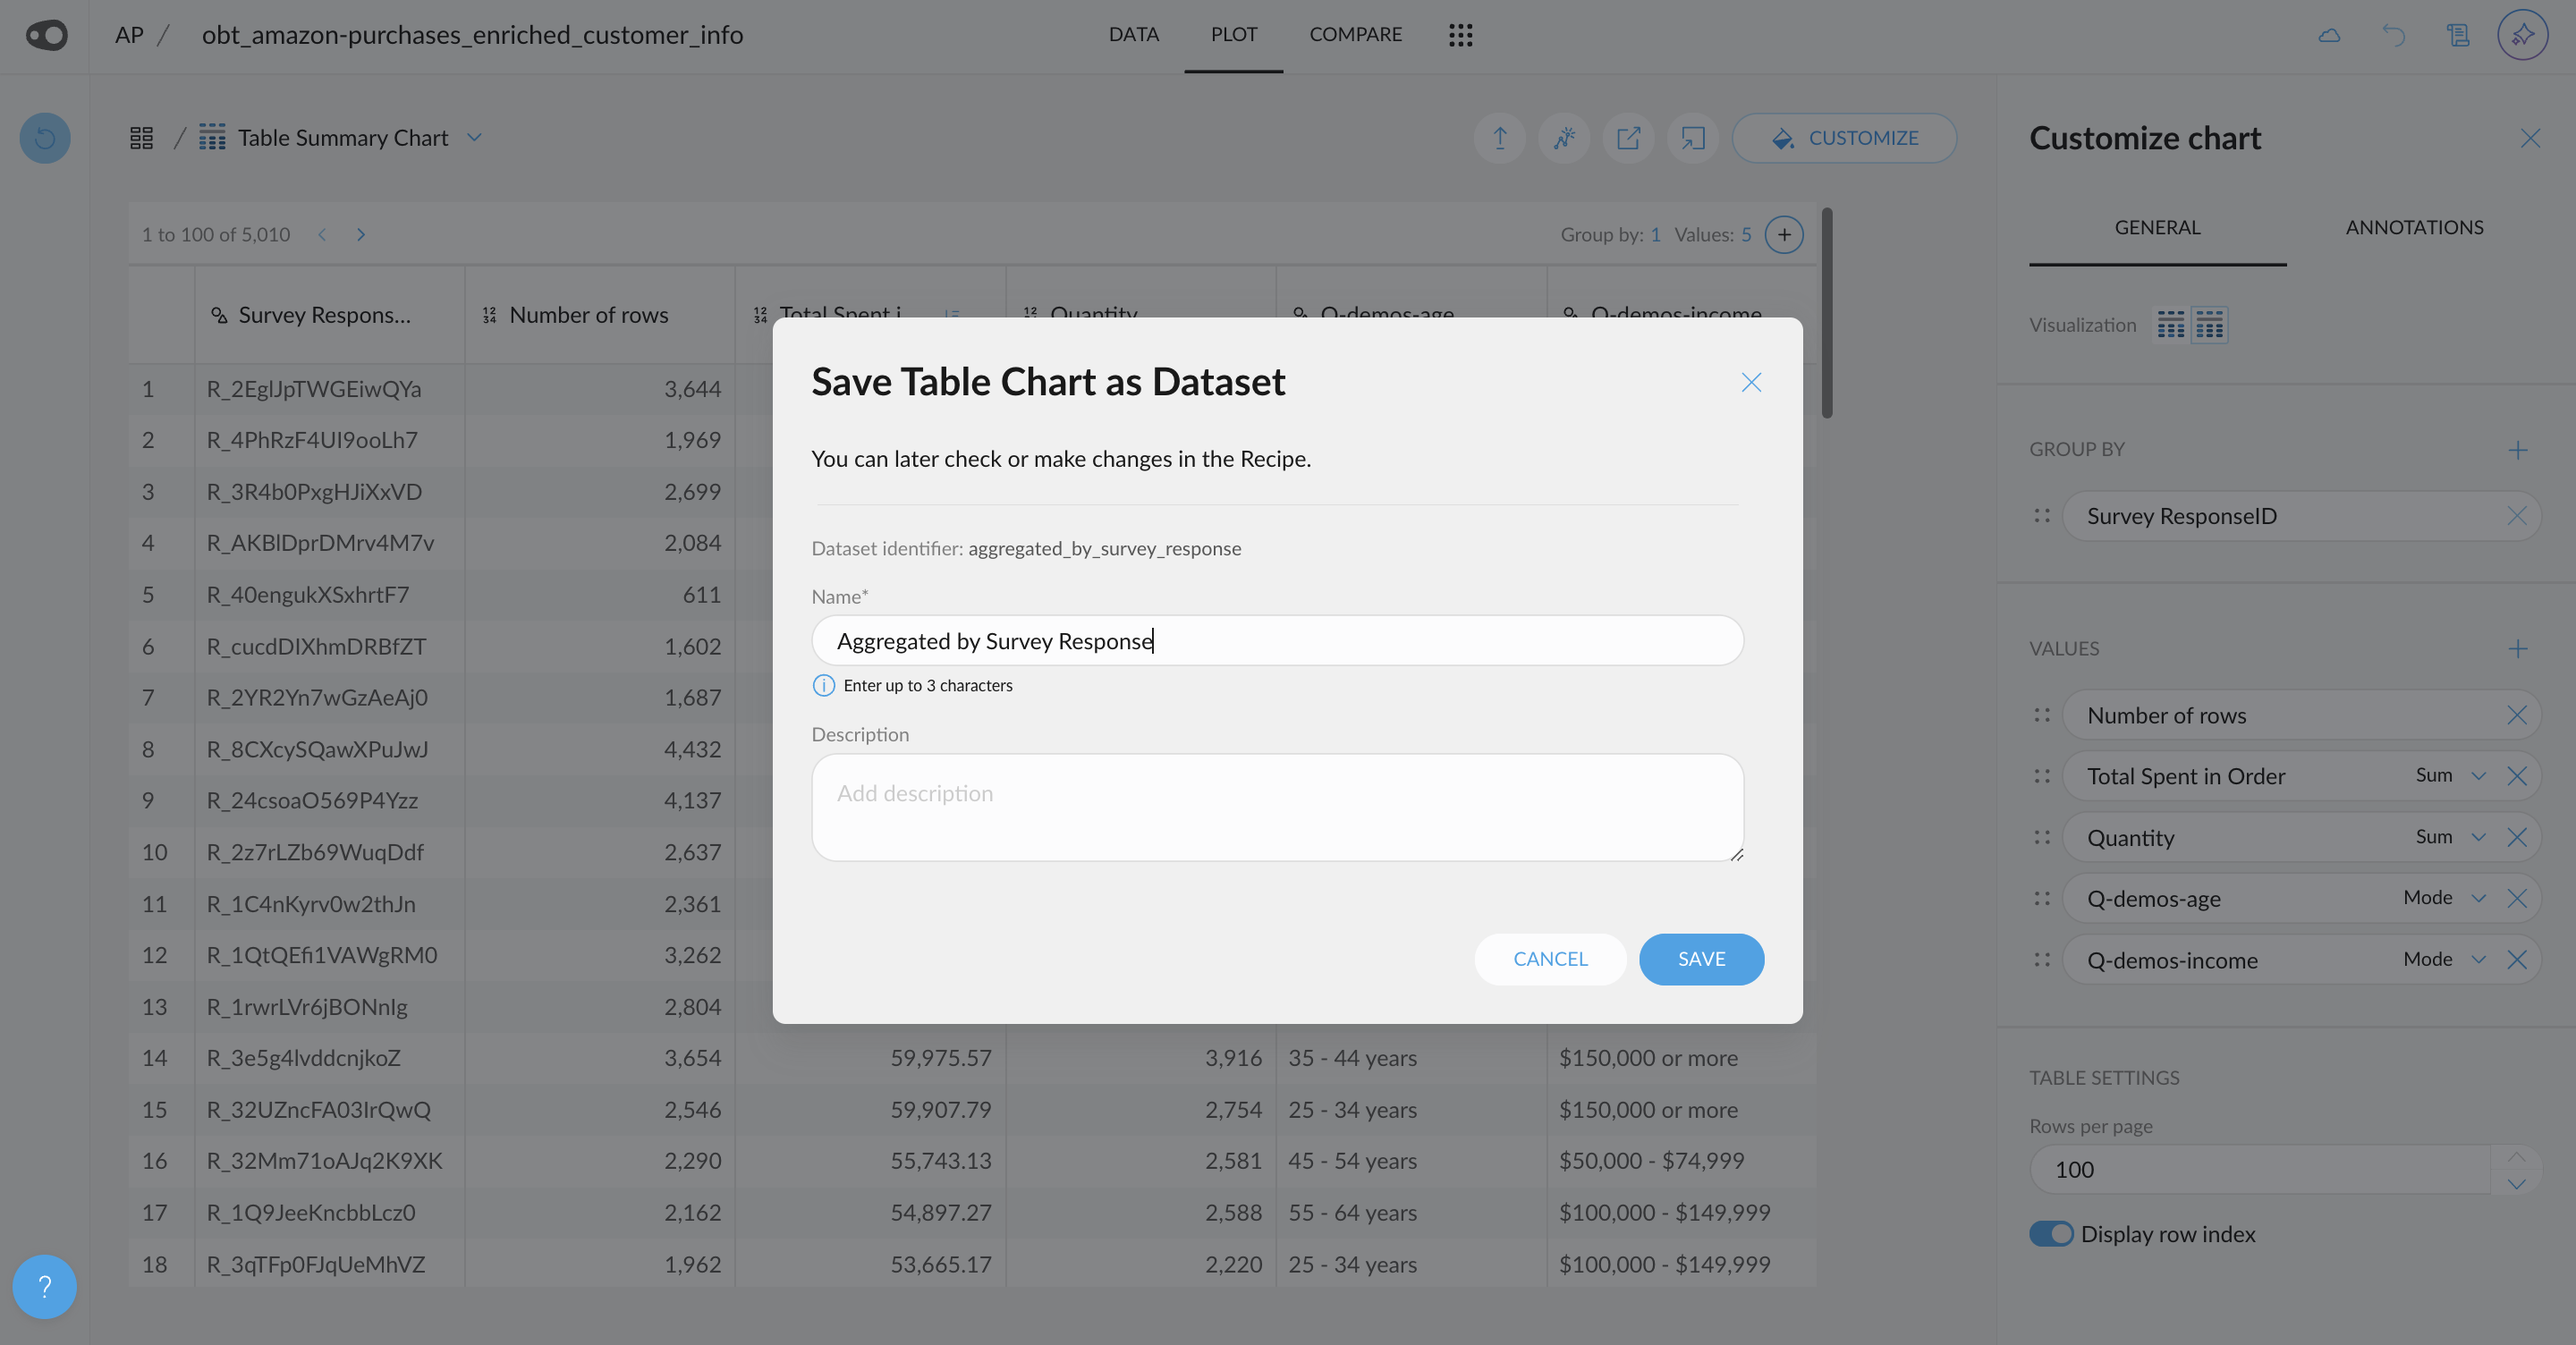
  • Save Summary Table as Dataset: Add the ability to save the summary table (group by) from plots as a new dataset, enabling users to load it in the Data tab for further exploration. This streamlines workflows and allows deeper analysis by treating the summarized data as a base dataset, for example grouping a dataset of transactions by user id
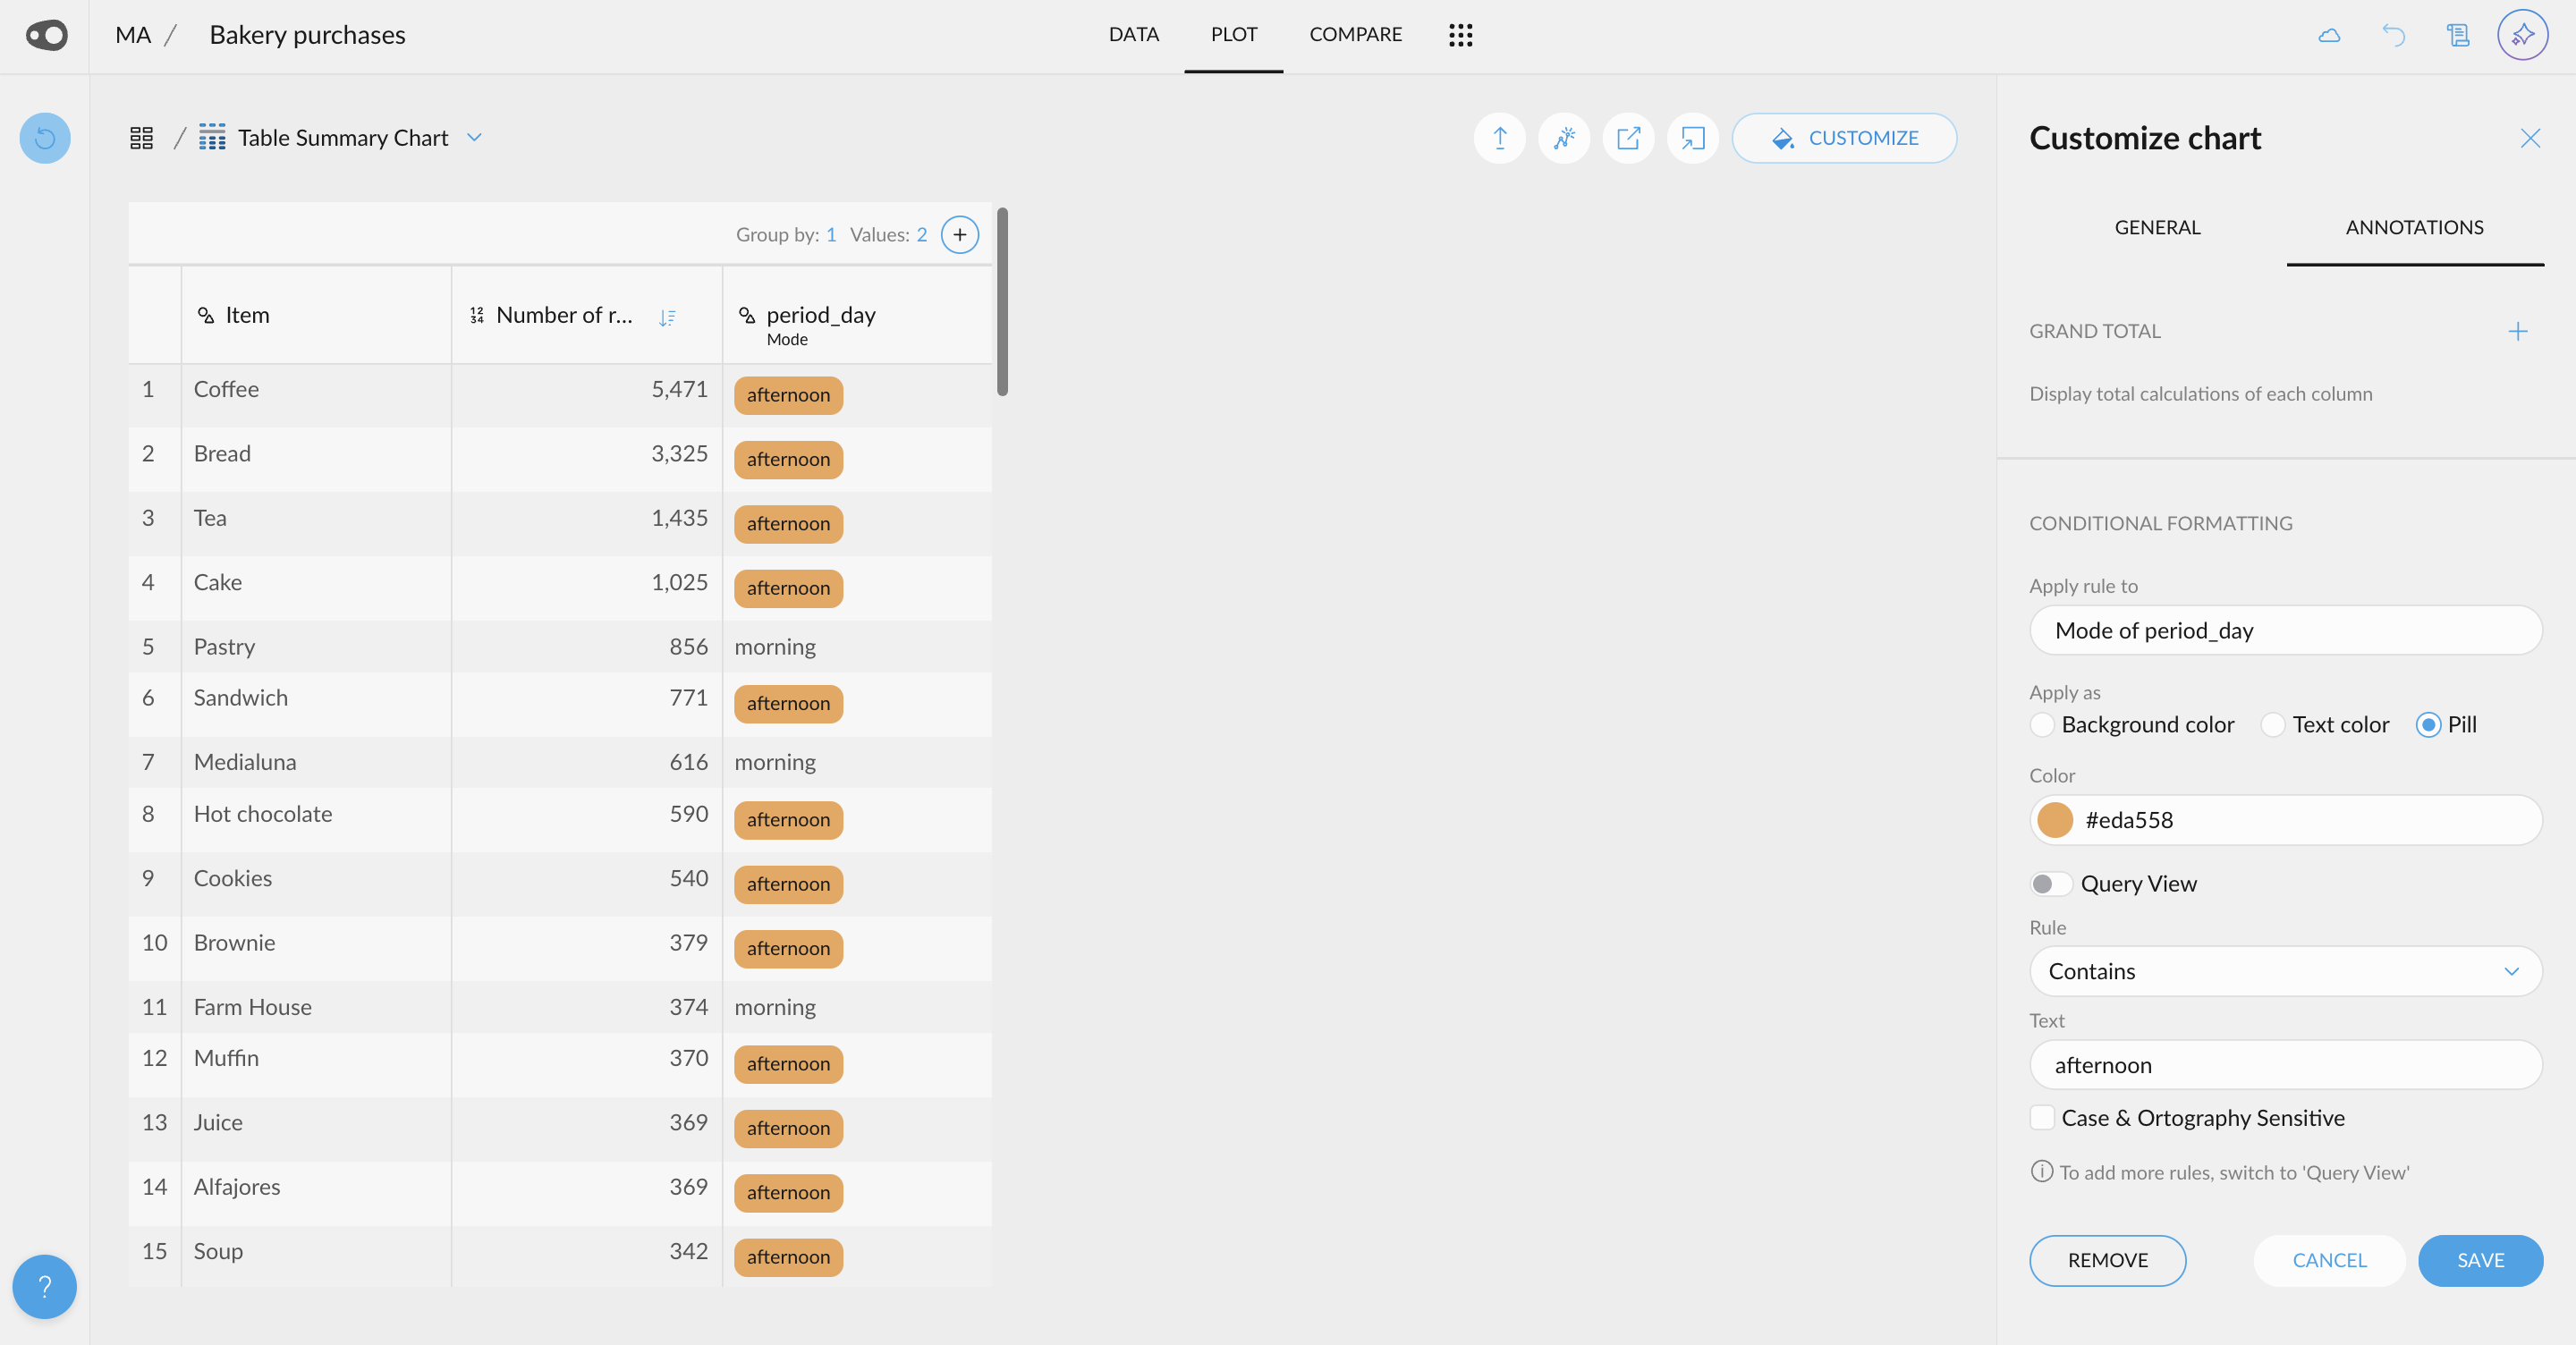
  • Conditional Cell Highlighting in Tables: Add the ability to color table cells based on conditions for all variable types. For example, highlight exam marks below 5 in red or emails containing @gmail.com in yellow. Users can choose from three highlight styles: pill, background, or text, with automatic text color adjustment (white or black) to ensure perfect readability against the background.
  • Display Value Counts: Introduce the option to show the value count next to the Y-axis value in plots, indicating how many rows or samples are represented in each group. For example, in a bar chart of job titles with the highest average annual income, users can see the sample size alongside the income to validate whether the data is representative or is just an outlier
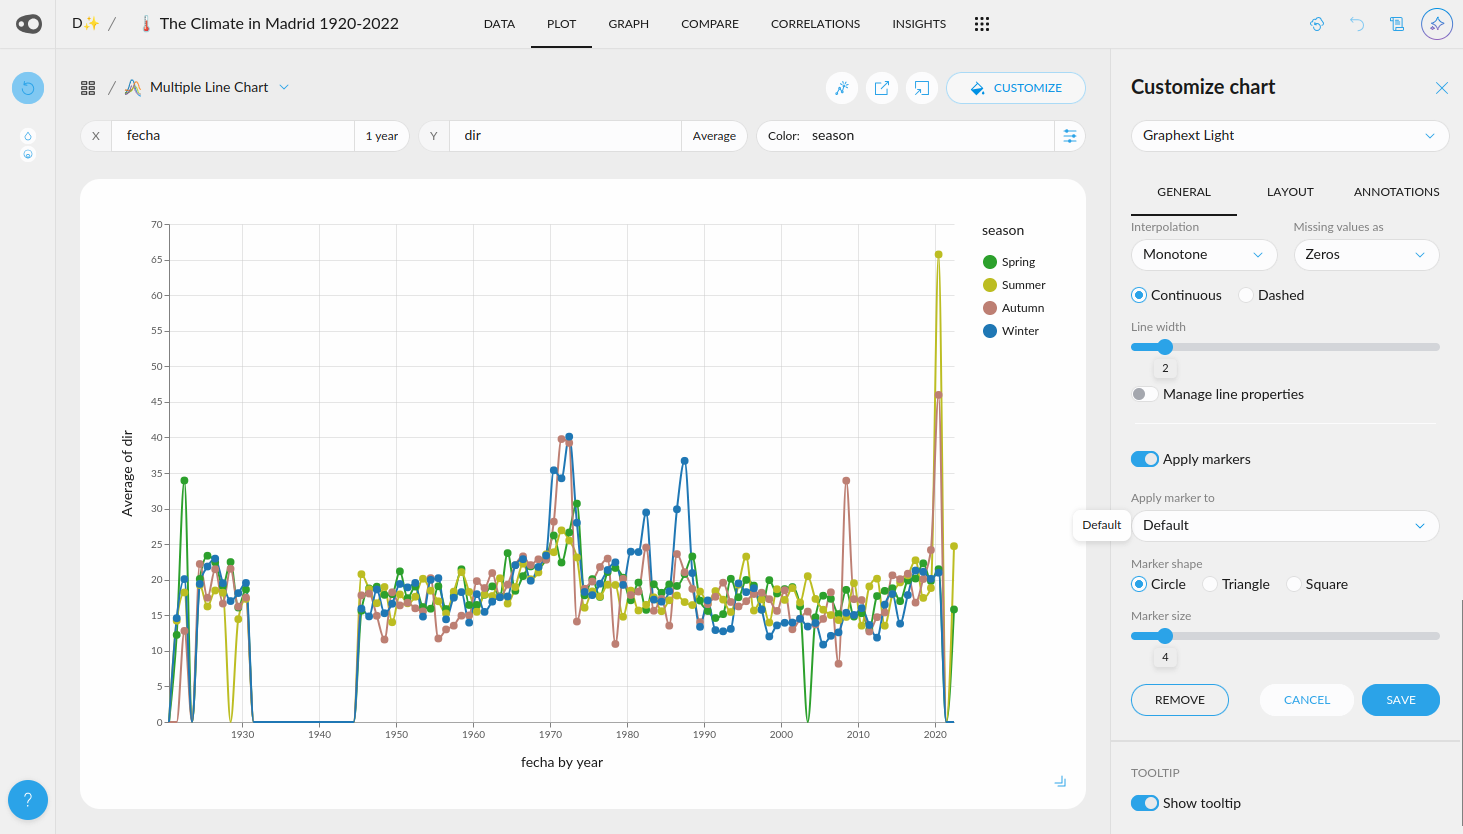
  • New interpolation options: Add control in Plot for showing missing values in line charts. You have three options: As solid lines, as gaps or as zeros.
  • Check Connection Status & Query Preview: You can now verify if the connection to your data source is successful and preview your query results before committing to create a project. This ensures a smoother setup process and saves time by letting you address any issues upfront.
  • Segmentation Query Editing: Enable query editing directly from the UI, allowing users to refine and customize the logic behind their segmentation with ease.

🛠️ Improvements

  • Decimal Format Selection: Introduce the option to customize the decimal format for quantitative columns, providing greater control over data presentation and ensuring consistency and clarity in numerical displays.
  • Advanced Search: Enable the use of the advanced query builder UI for searching within variables by clicking on the magnifying glass

🎨 UI Updates

  • Plot Line Markers alway active: Plot Line Markers are now active by default & can be configured in General tab in the Customization panel (instead fo Annotations tab)
  • Numbers format: The current format configuration (for numbers) is now visible in the Account Settings modal

🔧 Technical Updates

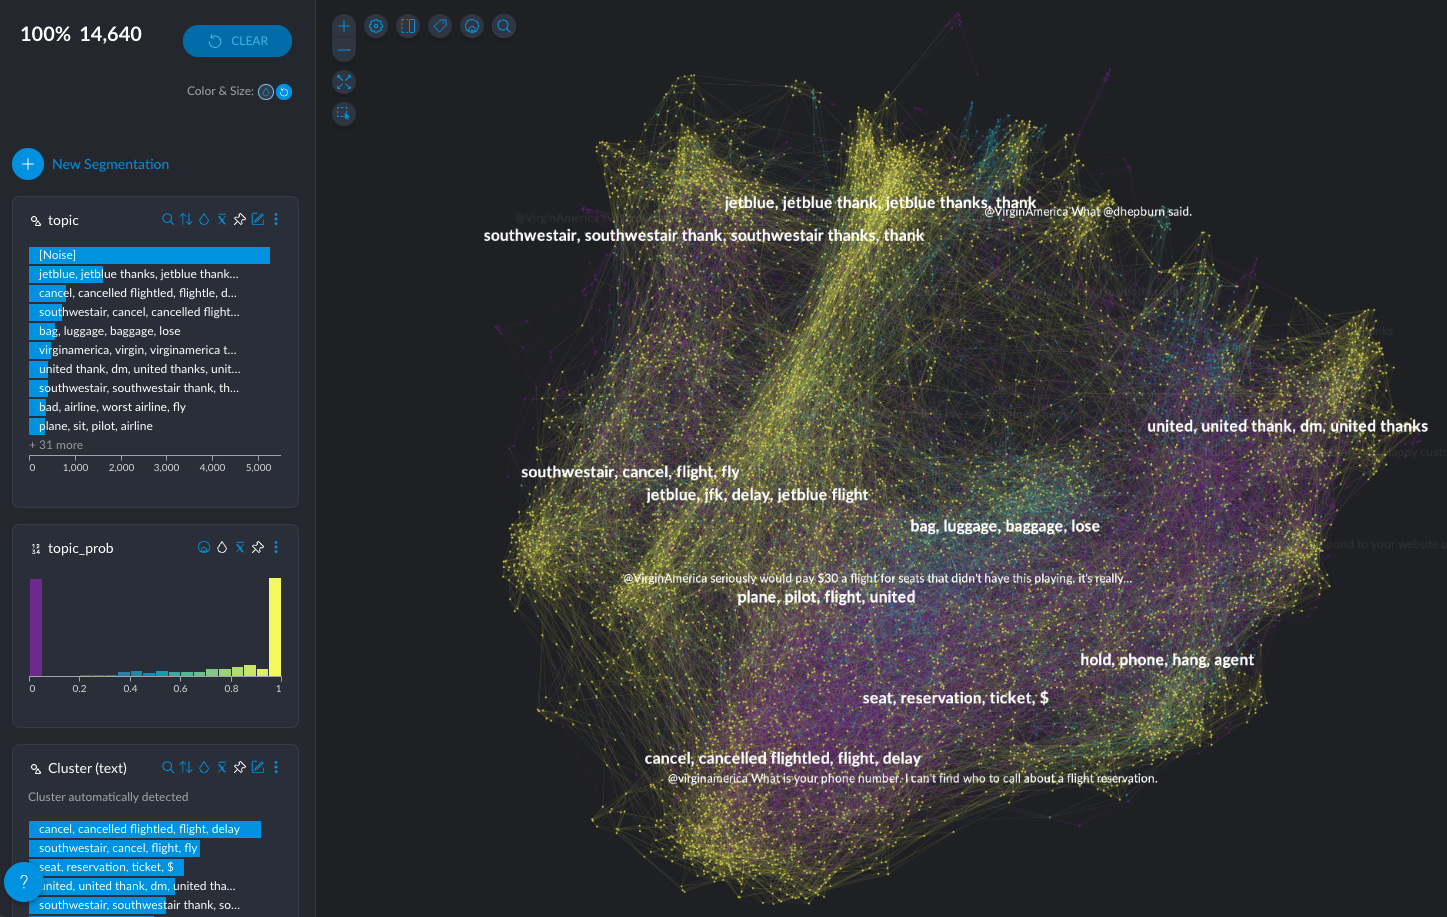
  • Cluster probabilities for HDBSCAN: when a second output column is requested in ”cluster_dataset" or ”cluster_embeddings" it will contain the probability that a data point belongs to the assigned cluster:

https://docs.graphext.com/api-docs/analyse/graph_and_map/cluster_dataset#outputs

  • Time-based validation of ML models (train on past, test on recent data)

November 12, 2024

🌟 New Features

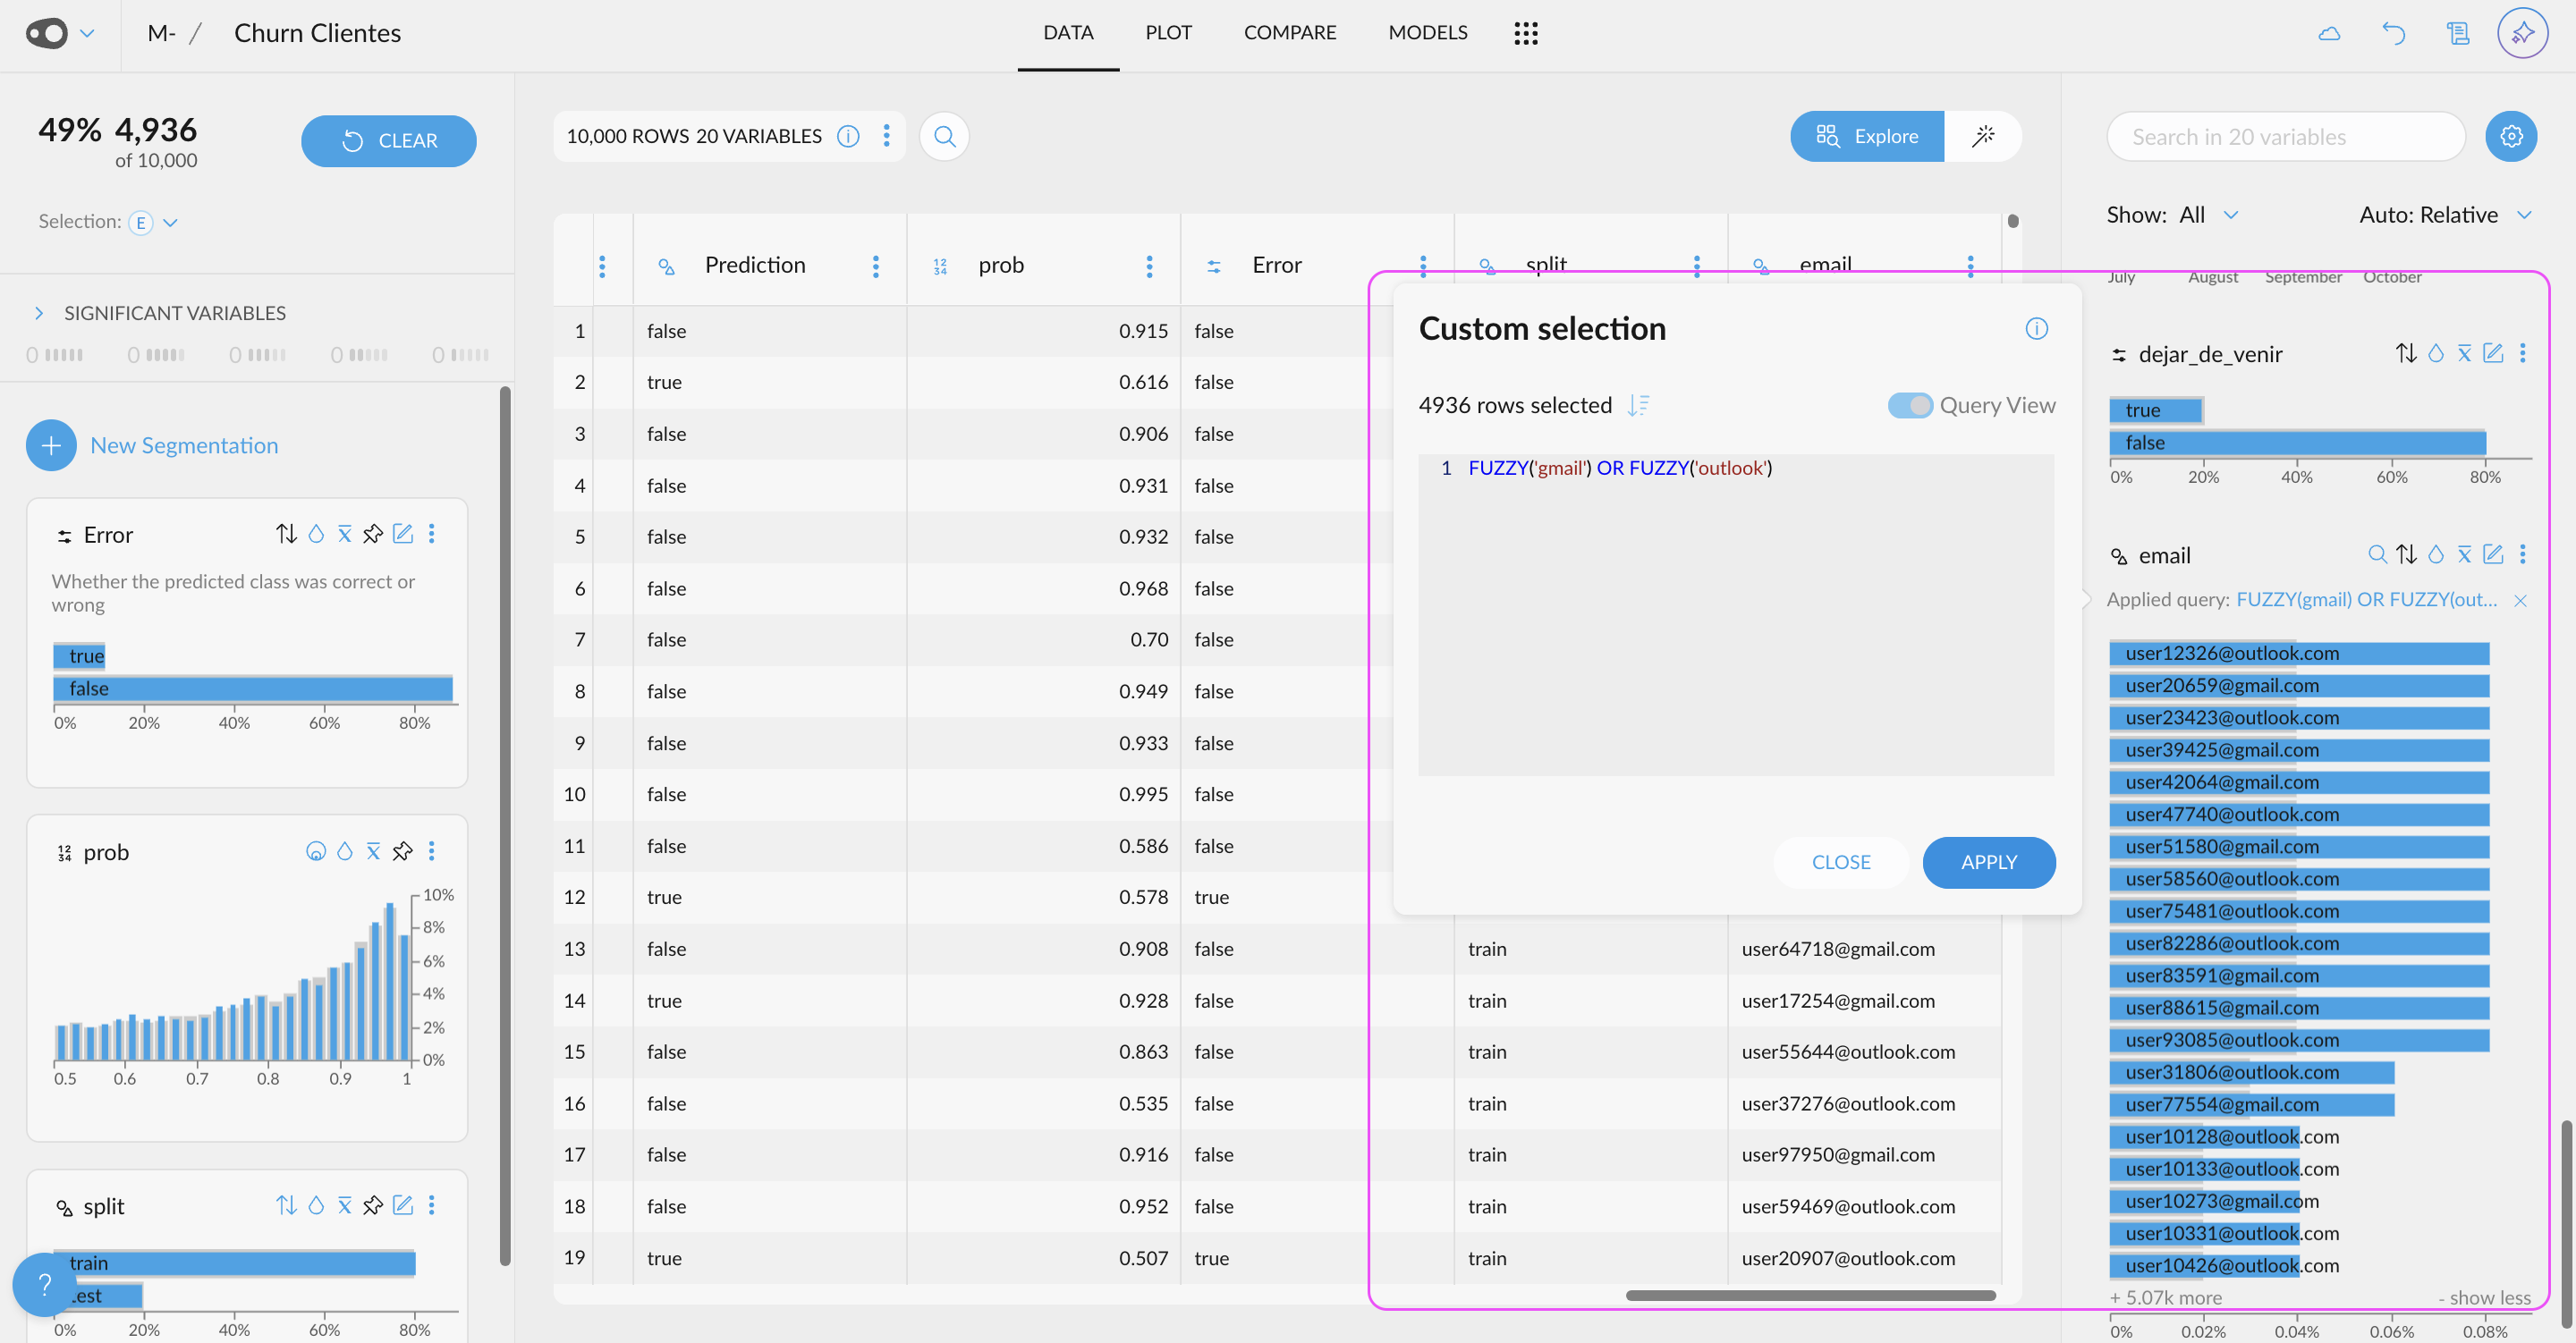
  • Custom Queries for Variables: You can now perform custom queries on each variable, enabling faster category searches and more advanced queries that were previously not possible, such as AND conditions in categorical columns or disjoint ranges in numerical columns (e.g., "younger than 18 or older than 65"). For basic searches, a user-friendly UI is available, making it seamless, while for more advanced queries, a query editor and detailed documentation are provided to help you learn how to craft and execute complex queries.

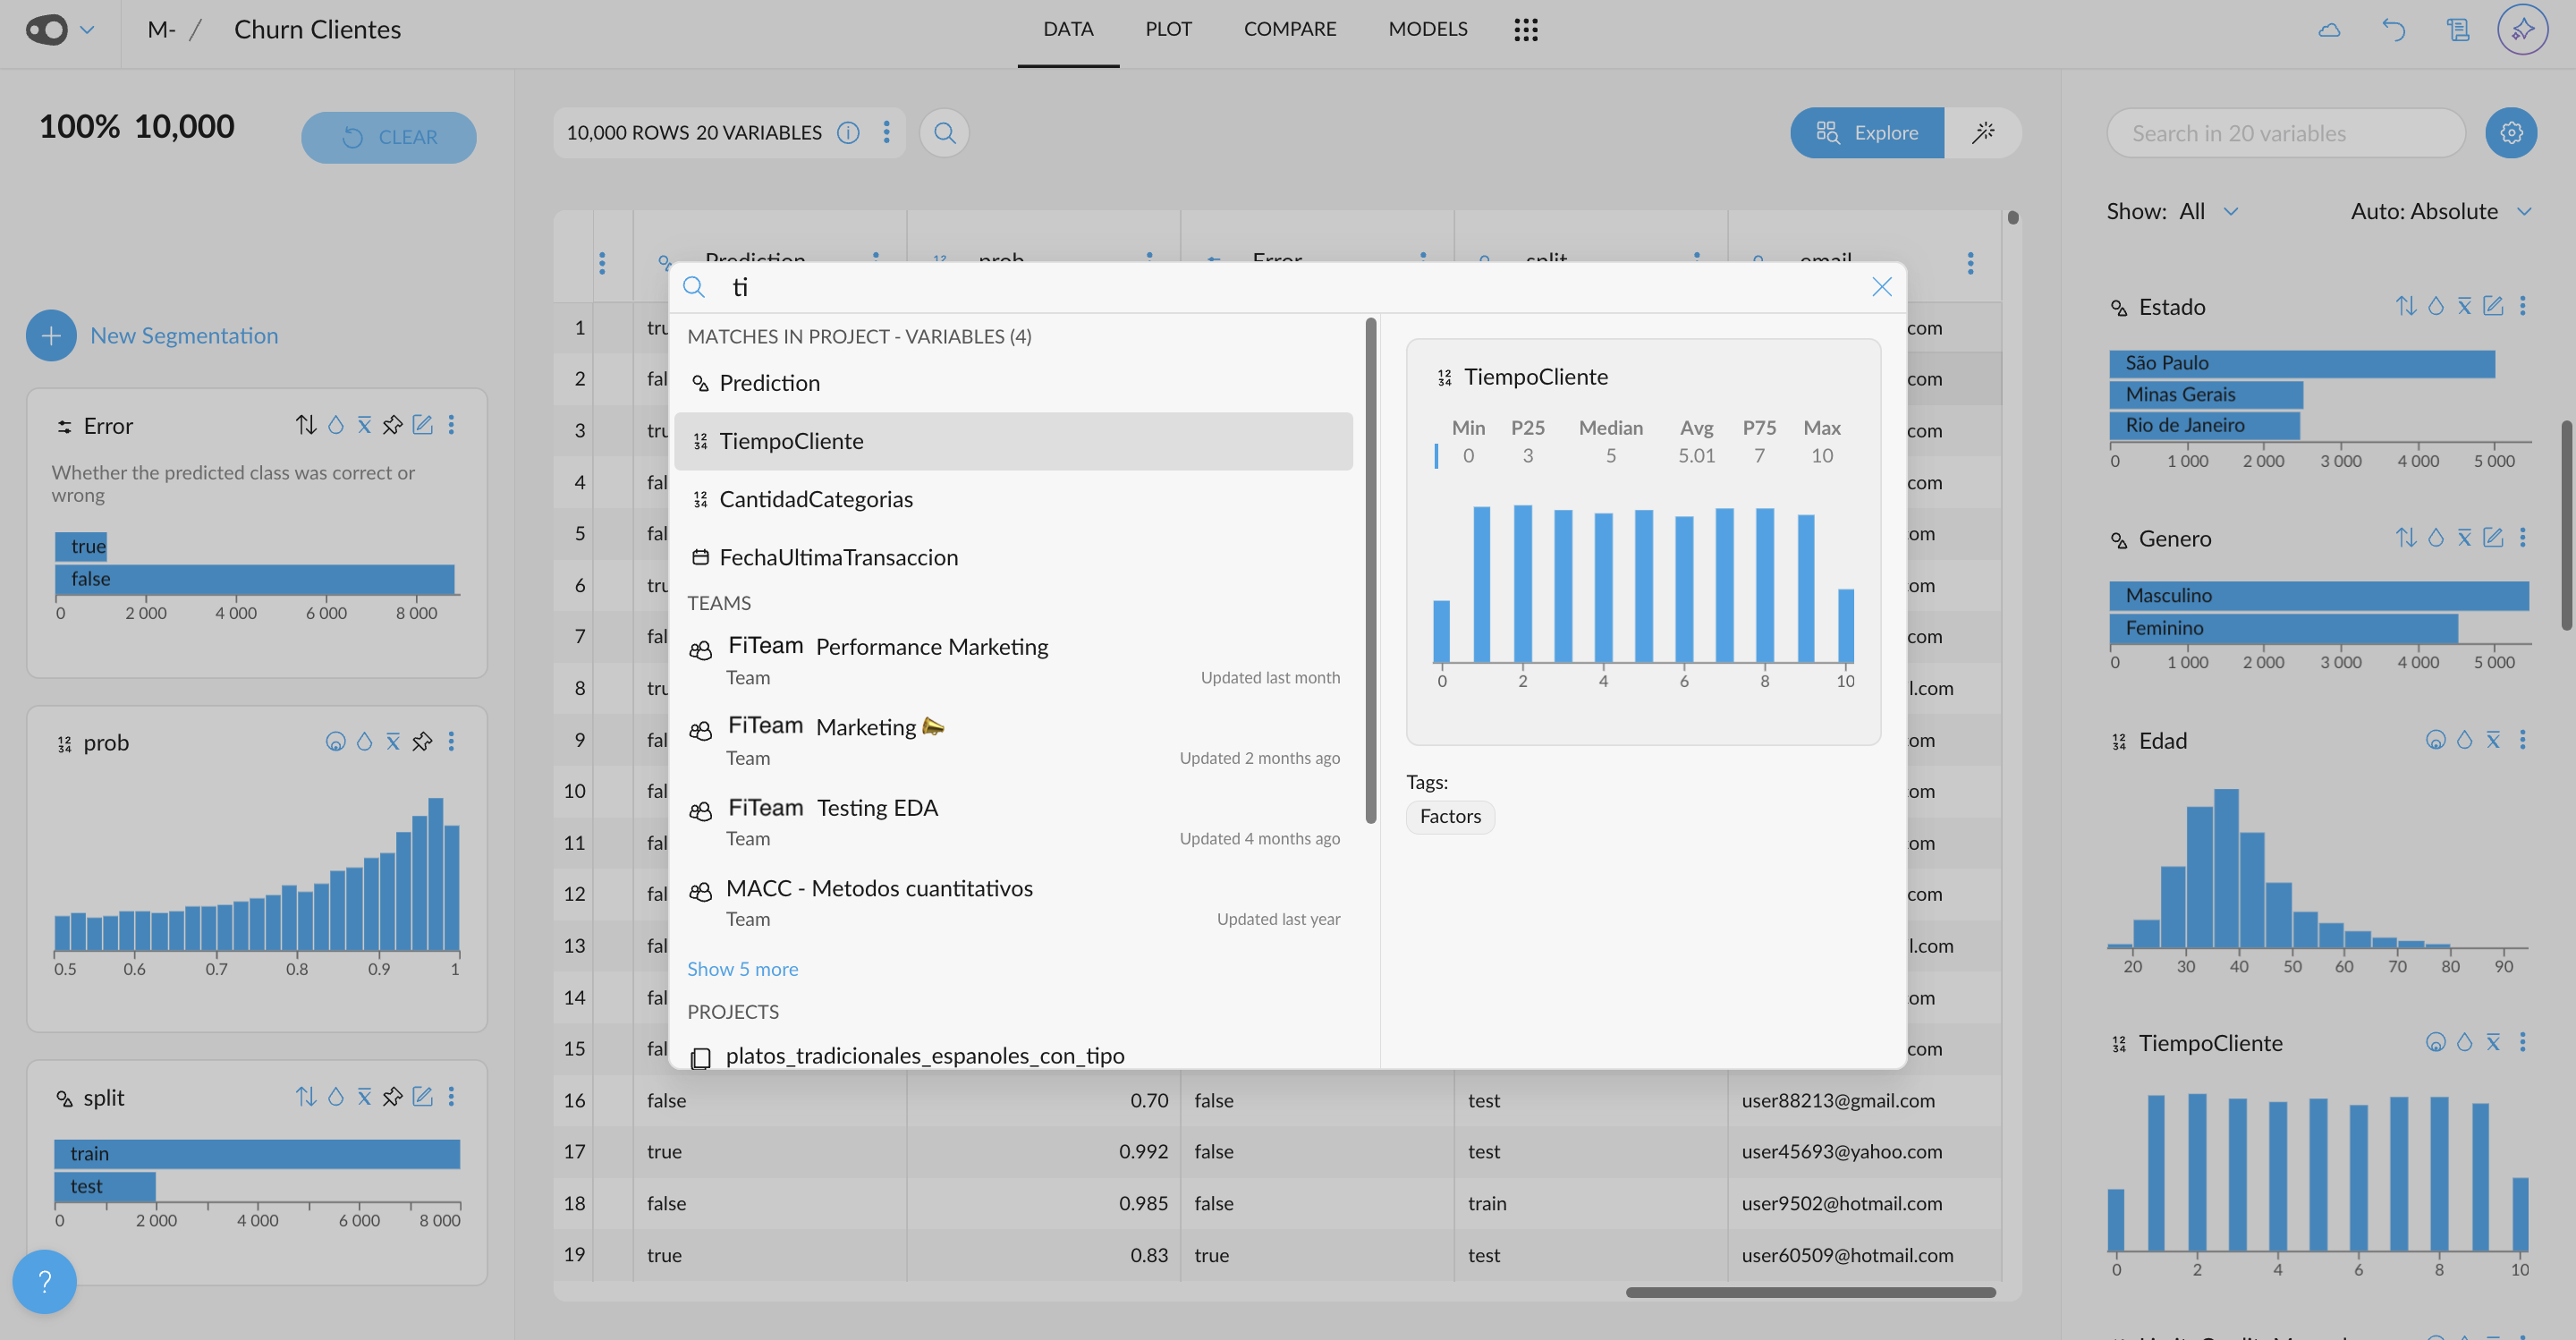
  • Search for Variables in Cmd+K Omnibar: You can now search for variables from any section of Graphext directly through the Cmd+K omnibar. You'll be able to preview the distribution of those variables, making it easier to explore and analyze them without navigating through multiple sections.

🛠️ Improvements

  • Improved “prompt_ai” Step: There's no longer a need to be so explicit when forcing the output, making it more intuitive to use. A new JSON schema mode has been introduced for more structured data outputs. We now ensure that only the explicitly defined categories are returned, streamlining the results and ensuring more relevant outputs.

🔧 Technical Updates

  • Add support for Date columns in replace_values step
Page 1Next